Title

LYON, MENCKHOFF, SHIVER
BEDSIDE
ULTRASOUND

COPYRIGHT
© Bedside Ultrasound - Center of Ultrasound Education
2016 Edition
Written, Edited, and Produced by:
!
Matthew Lyon, MD
Carl Menckhoff, MD
Stephen A. Shiver, MD
Technical Writer: Sabrina Byrum, MTSC
Graphic Illustrator: Diantha Tevis, MS
Published by: Center of Ultrasound Education, Augusta University
A special thanks to Michael Shaw, DO, Patrick McDougal, MD, Srikar Adhikari,
MD, Theta Coker, RN, and Becky Mueller for their assistance with this project.
Center of Ultrasound Education
Medical College of Georgia
1120 15th St., Augusta, GA 30912
Tel: 706-721-4467 Fax: 706-721-7718
Email: ultrasoundeducation@augusta.edu
www.MCGultrasoundeducation.com$!
EUSacademy.com
Copyright 2016. All rights reserved. No part of this publication may be
reproduced, stored in a retrieval system or transmitted in any form or by any
means including digital, electronic, mechanical, optical, photocopying,
recording or otherwise without written permission of author.
Printed in the United States of America!
ISBN 978-0-9801911-0-3
i

FORWARD
Ultrasound is a transformative
educational technology. It changes how
we understand and teach physiology,
makes anatomy more interactive, and
demonstrates pathology in a dynamic
way. At the bedside ultrasound is
unique in its ability to enhance the
physical exam, modify how physicians
formulate a differential diagnosis, and
refine the way they treat and relate to
their patients. As advanced imaging
technology has become a cornerstone
of modern medicine, physicians have
become less reliant on physical exam
skills. Physician-performed ultrasound,
unlike CT and MRI, connects
physicians to patients, uniting them in
the process of diagnosis and treatment.
$
While ultrasound technology is not
new, the advent of hand-held
ultrasound machines with sufficient
image quality and affordability is now
allowing for the use of ultrasound by a
wide range of physicians. This trend
will only accelerate in the future, and
the ultrasound machine will become as
ubiquitous as the stethoscope in the
daily practice of medicine. As
educators of tomorrow’s physicians, we
must invest in the future of our
students and residents by teaching
ultrasound skills and demonstrating the
integration of ultrasound in to clinical
practice throughout their training. This
approach will transform medical
education and the practice of medicine
by augmenting physician skills,
improving quality of care, decreasing
cost, and most importantly by bringing
physicians back to the patient’s
bedside.
$
Our vision is to be an internationally
recognized leader of ultrasound
education for
undergraduate, graduate, and
continuing medical education.
$
Our Mission is to provide for the
advancement and integration of
physician-performed ultrasound in
education and research throughout
each stage of medical education in
order to improve the quality of medical
education and practice, while also
ii

providing quality cost-effective patient
care.
How to use this book
This book is divided into chapters
based on individual ultrasound
examinations. Each chapter gives the
indications, goals, probe selection, and
patient positioning for each exam. For
each exam, probe positioning as well
as normal and abnormal anatomy are
described. Also, pearls and pitfalls are
provided for each examination, and a
suggested method for integrating the
ultrasound exam into clinical practice is
provided. It is important to consider
that the clinical integration model will
vary based on the reader’s level of
ultrasound experience and the location
of practice. Each chapter concludes
with ultrasound diagrams that
demonstrate normal and abnormal
findings as well as appropriate probe
positioning for image acquisition.
iii
Equipment
EQUIPMENT
CHAPTER 1
4

5
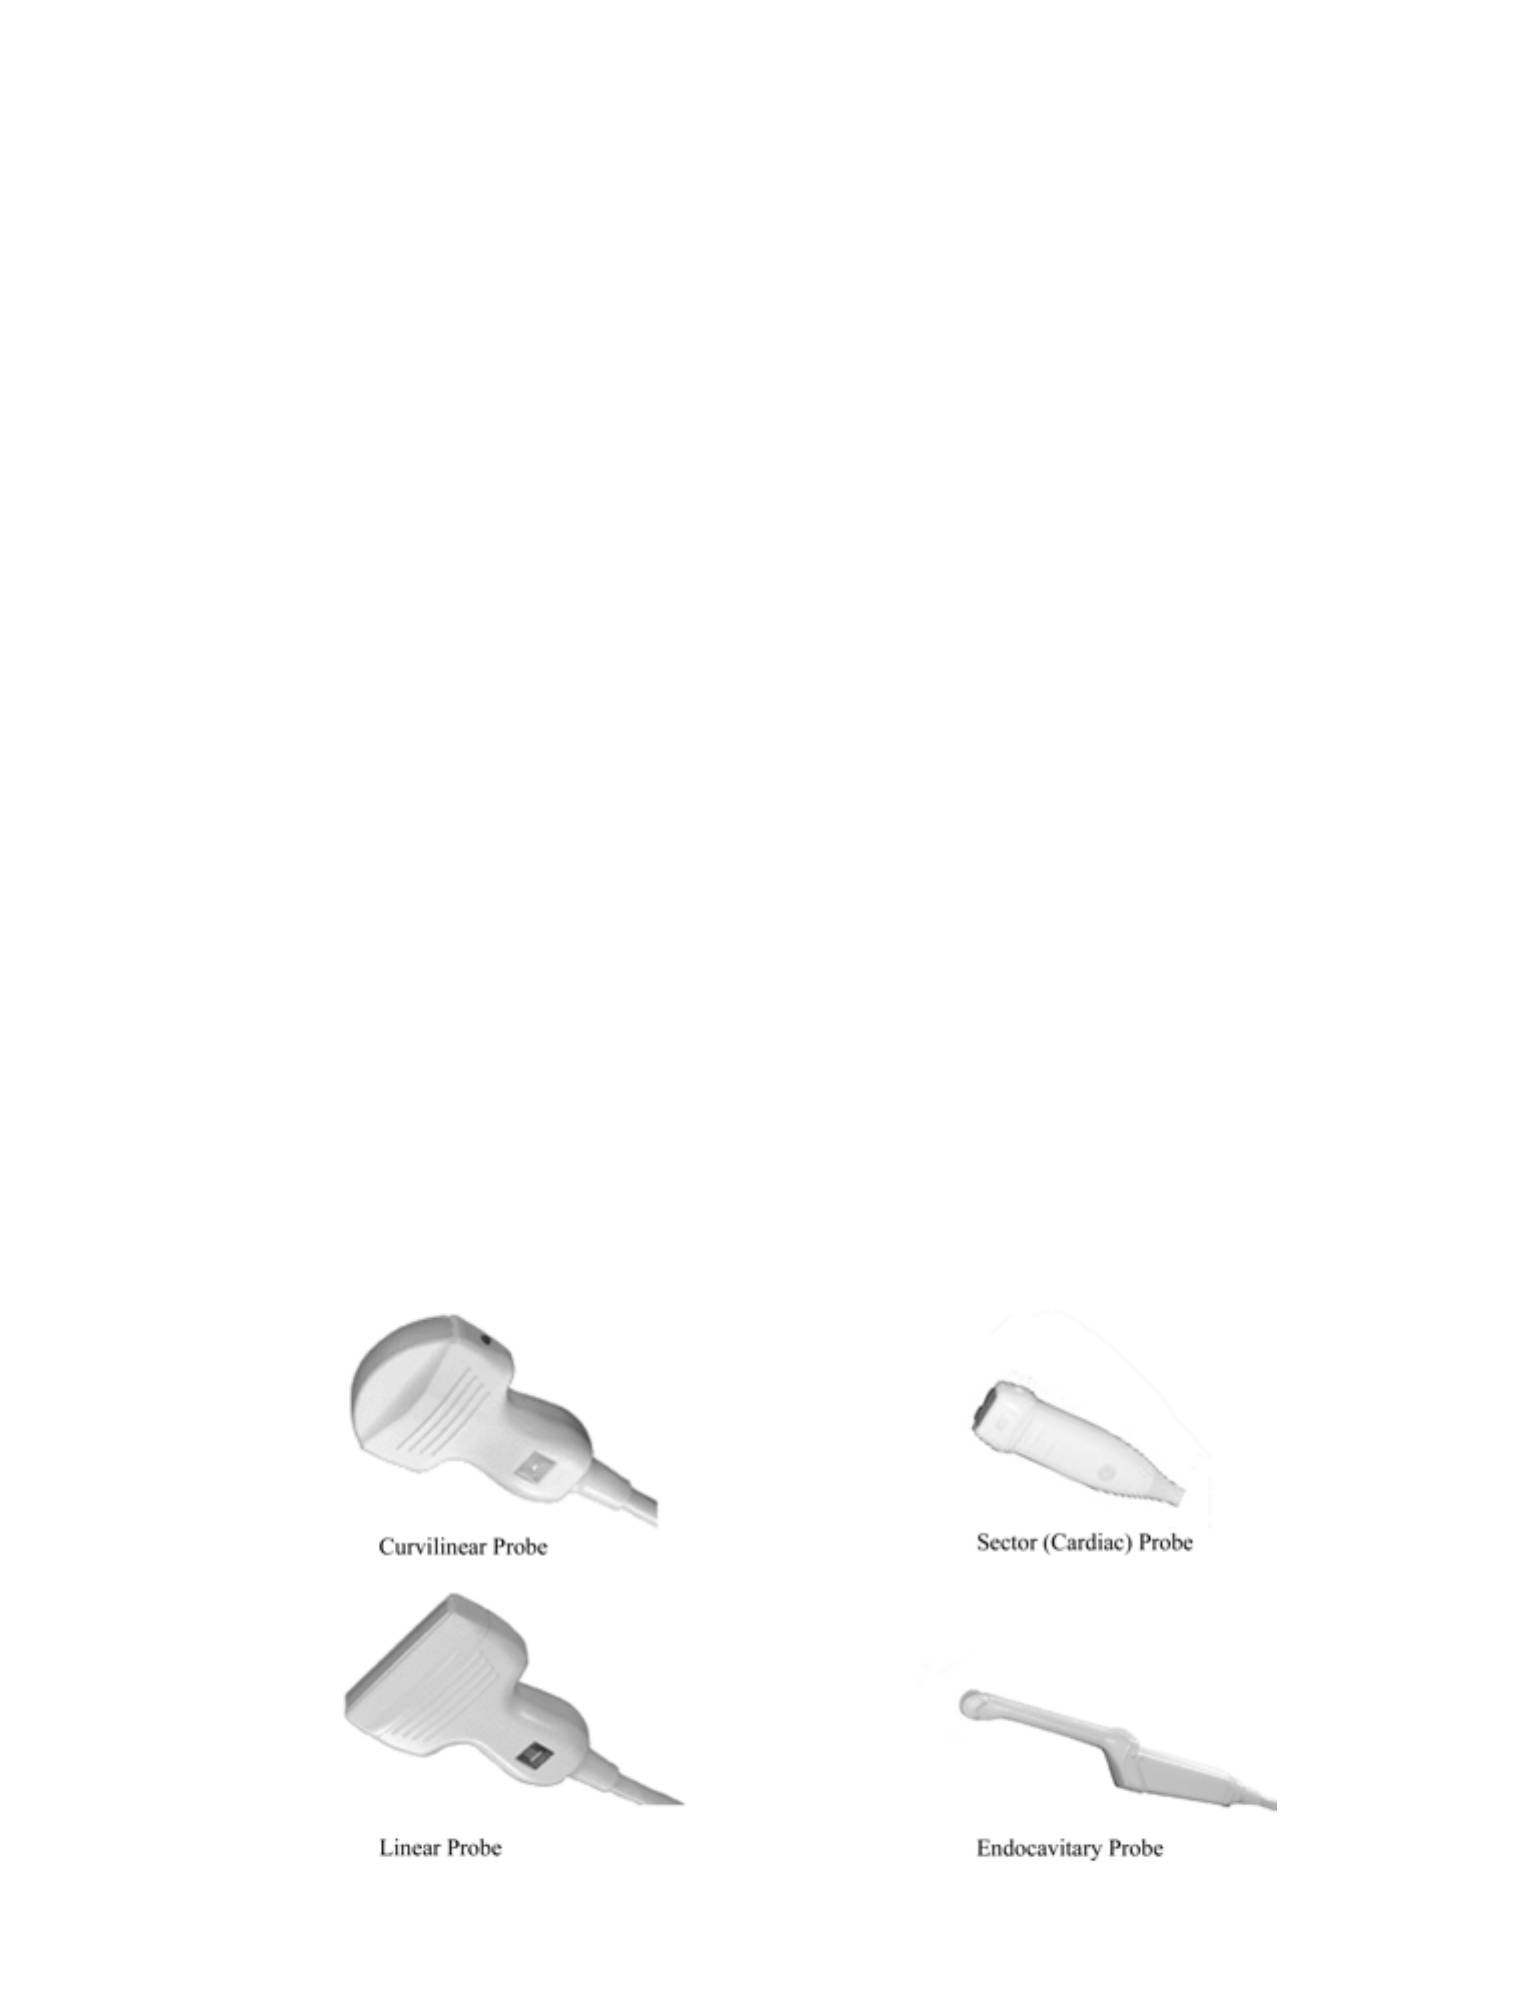
Linear Sequential Array (Linear Probe)
Function
•
Multiple small transducer elements electronically coordinated to produce a
rectangular image
•
Beam is perpendicular to face of probe
•
Usually used for imaging of superficial smaller structures
•
Imaging of vascular structures in which Doppler is needed
•
Produces a more anatomically correct image; thus, it is useful for ultrasound-
guided procedures
•
Typical frequency range: 4-10 MHz
Advantages
•
Provides a good near field image - allowing imaging of superficial structures
•
Allows for beam steering, an important quality for Doppler ultrasound
Disadvantages
•
Flat probe face does not conform well to curved body surfaces
•
Less penetration; therefore, poorer imaging of deep structures due to its
higher frequency
Curvilinear Array (Curved Probe)
Function
•
Linear array transducer with a curved scan head which produces a
trapezoidal field of view
•
Beam is perpendicular to face of the probe
•
Lower frequency range and a broad field of view making it ideal for abdominal
imaging
•
Typical frequency range: 2-5 MHz
Advantages
•
Possesses a wider field of view than the footprint of the transducer
•
Curved face fits well into body surfaces
PROBE SELECTION

Disadvantages
Large footprint makes it difficult to image through small ultrasound windows
Sector Phased Array (Sector or Cardiac Probe)
Function
Small transducer head with multiple pinpoint elements that produce a pie-shaped
image
Typical frequency range: 1.5-4 MHz
Advantages
Small footprint and pie-shaped image allows for view through small ultrasound
windows such as between the ribs
Actual field of view is wider than the footprint
Disadvantages
Small near field of view
Endocavitary Transducer (Transvaginal Probe)
Function
A specialized, high-frequency curvilinear probe
Commonly used intravaginally in OB/Gyn applications
Typical frequency range: 4-8 MHz
Advantages
Specialized probe for imaging from inside cavities such as the vagina or oropharynx
Disadvantages
Has specific, limited uses
Pearls and Pitfalls
•
As the ultrasound frequency increases, the resolution improves, but the
penetration worsens.
•
Most modern US transducers are broadband, meaning that the transducer
uses a range of frequencies to balance the trade off between penetration and
resolution.
•
Some US machines allow for optimization of the broadband transducer
frequencies by changing the system settings from penetration (lower
frequencies) to general (middle frequencies) to resolution (higher frequencies).
6
•
Some US machines allow for focal zones. The focal zone represents the
narrowest portion of the ultrasound beam where resolution is best. The focal
zone should be set at or just below the point of interest.
•
Gain increases the brightness of the echoes displayed on the
•
US screen. Gain is different from power which increases the amount of sound
signal sent out from the transducer. Our eyes naturally prefer brighter screens.
As the gain is increased, however, contrast is decreased. It is best to image
with less ambient light (i.e. in a dark room) using only the amount of gain that
is required.
•
Most machines have time gain compensation (TGC). This funtcion allows for
selective amplification of the signal.
•
The TGC should be adjusted so that an object (e.g. the liver) is of the same
brightness from top to bottom.
•
Probe selection is critical for diagnostic accuracy. The optimal probe is listed
for each examination and should be used unless unavailable. Alternate probe
types are also listed, along with the advantages and disadvantages of each.
Probe Position
•
The convention is that the probe marker be pointing toward the patient’s head
or right side.
•
The exception to this is in the cardiac studies where the convention is that the
marker be pointing toward the patient’s head or left side.
7
Fast Exam

FAST EXAM
CHAPTER 2
Focused Assessment for Sonography for Trauma
8

9
Indications
•
Trauma or suspicion of trauma with any of the following:
•
Abdominal tenderness
•
Altered level of consciousness
•
Hypotension
Goals
•
To visualize free fluid (presumably blood) as a result of trauma, in the
abdomen or the pericardium
•
Can also be used to visualize free intraperitoneal fluid from atraumatic
sources
Probe
•
Curvilinear probe
•
Abdominal probe with 2-5 MHz frequency range
•
Sector probe
•
May occasionally be useful to visualize cardiac structures through the ribs
Patient Position
•
Supine
Standard Views and Probe Position
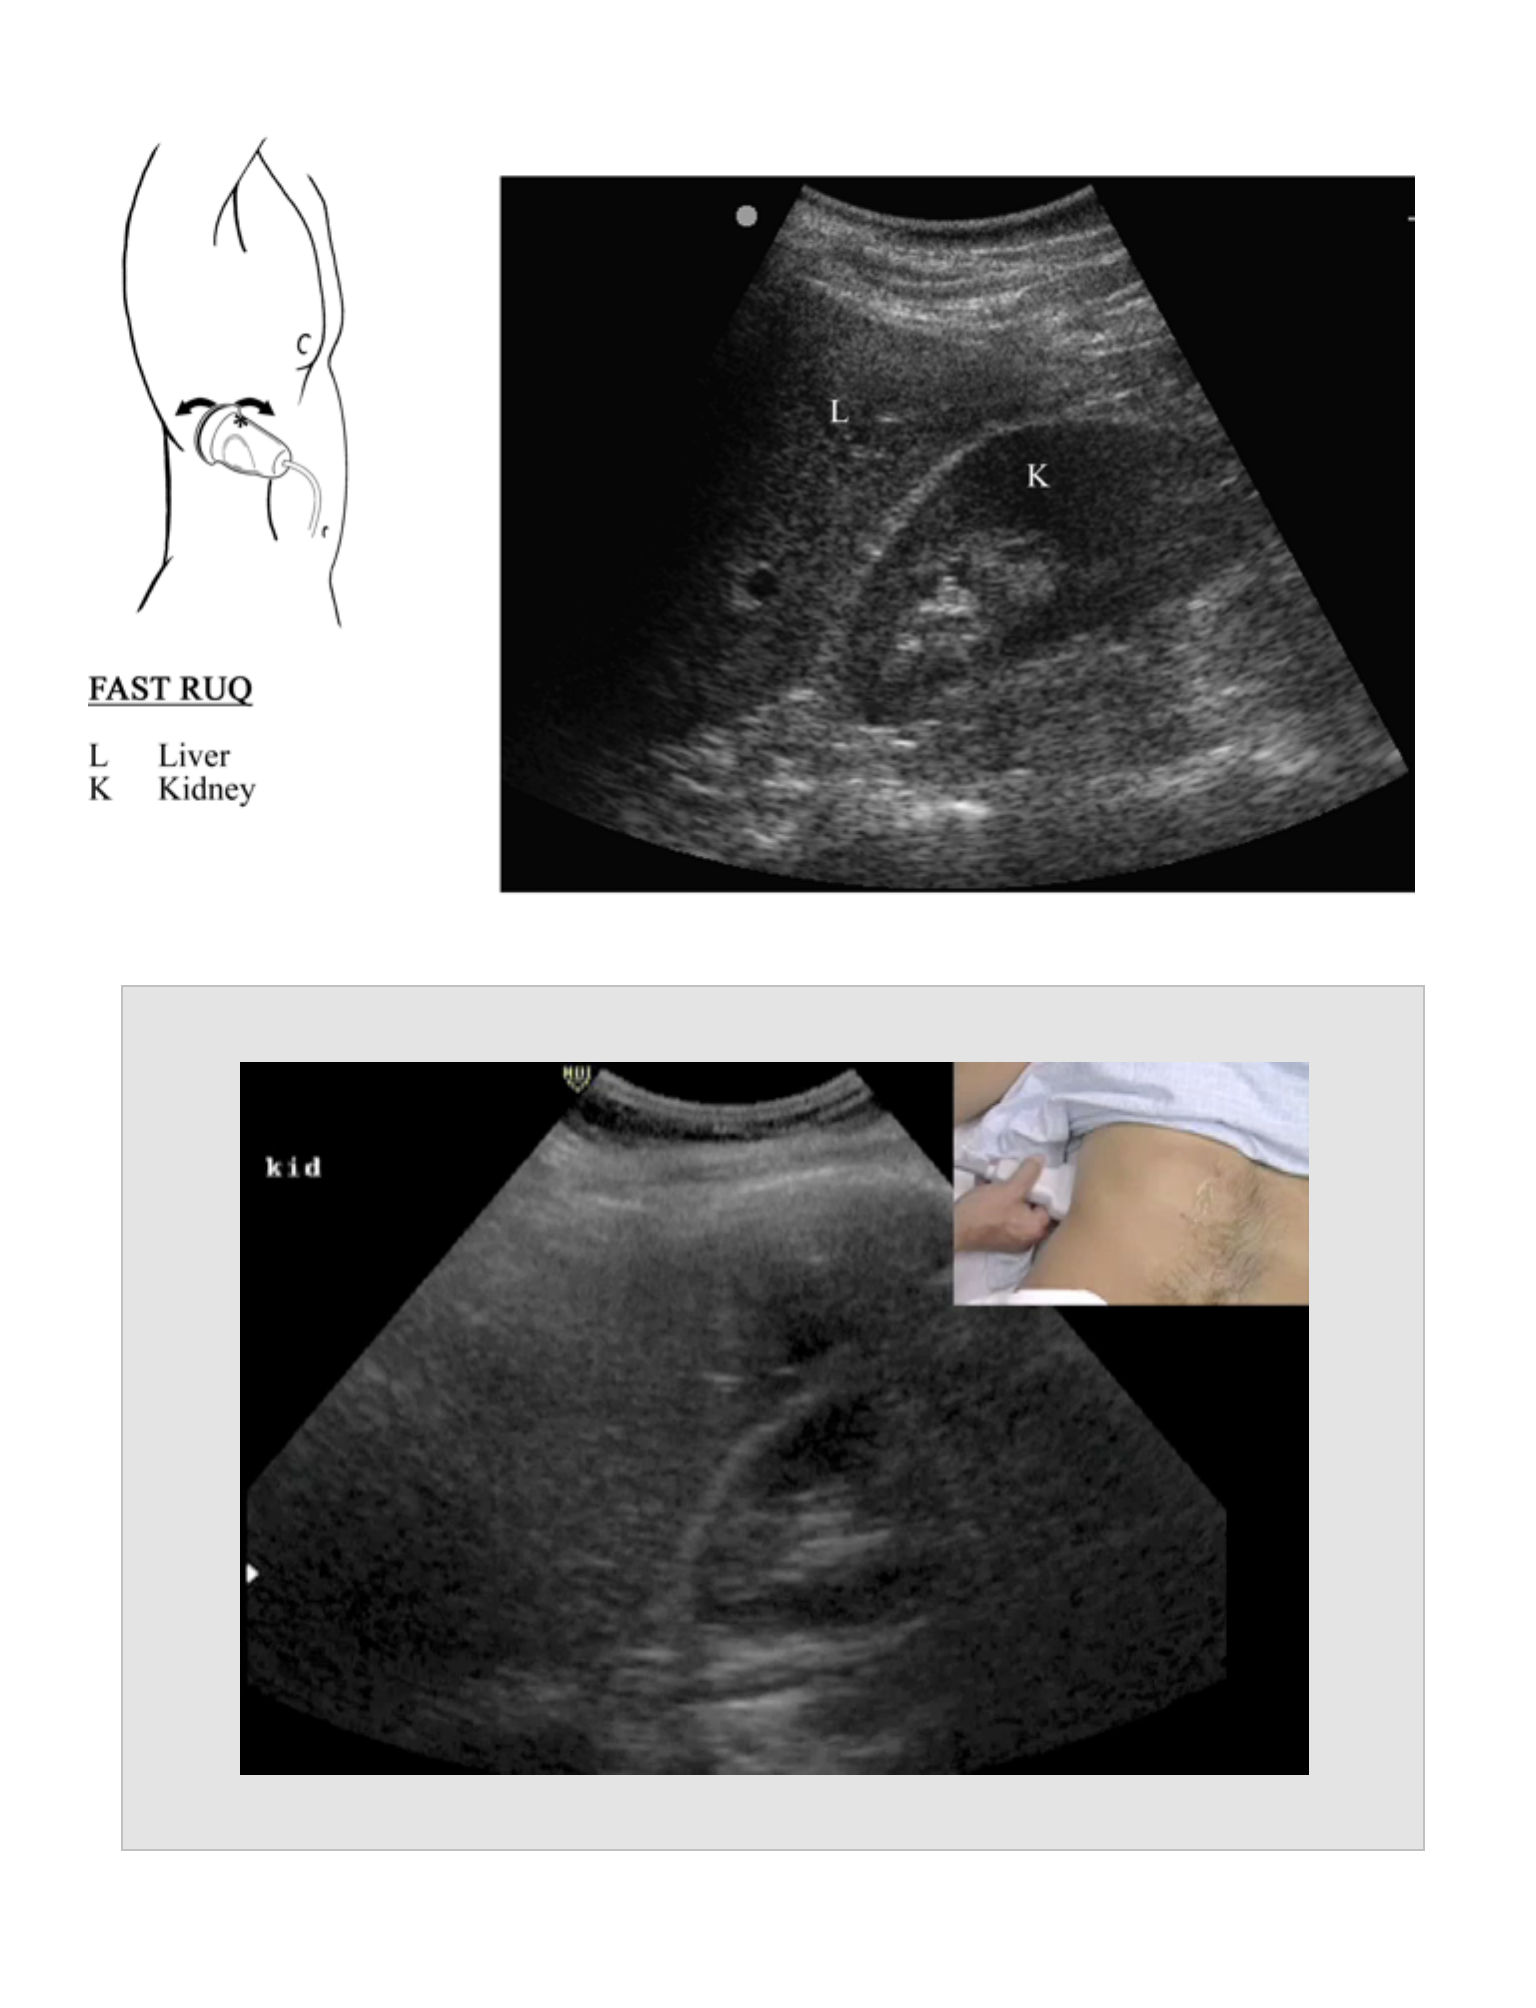
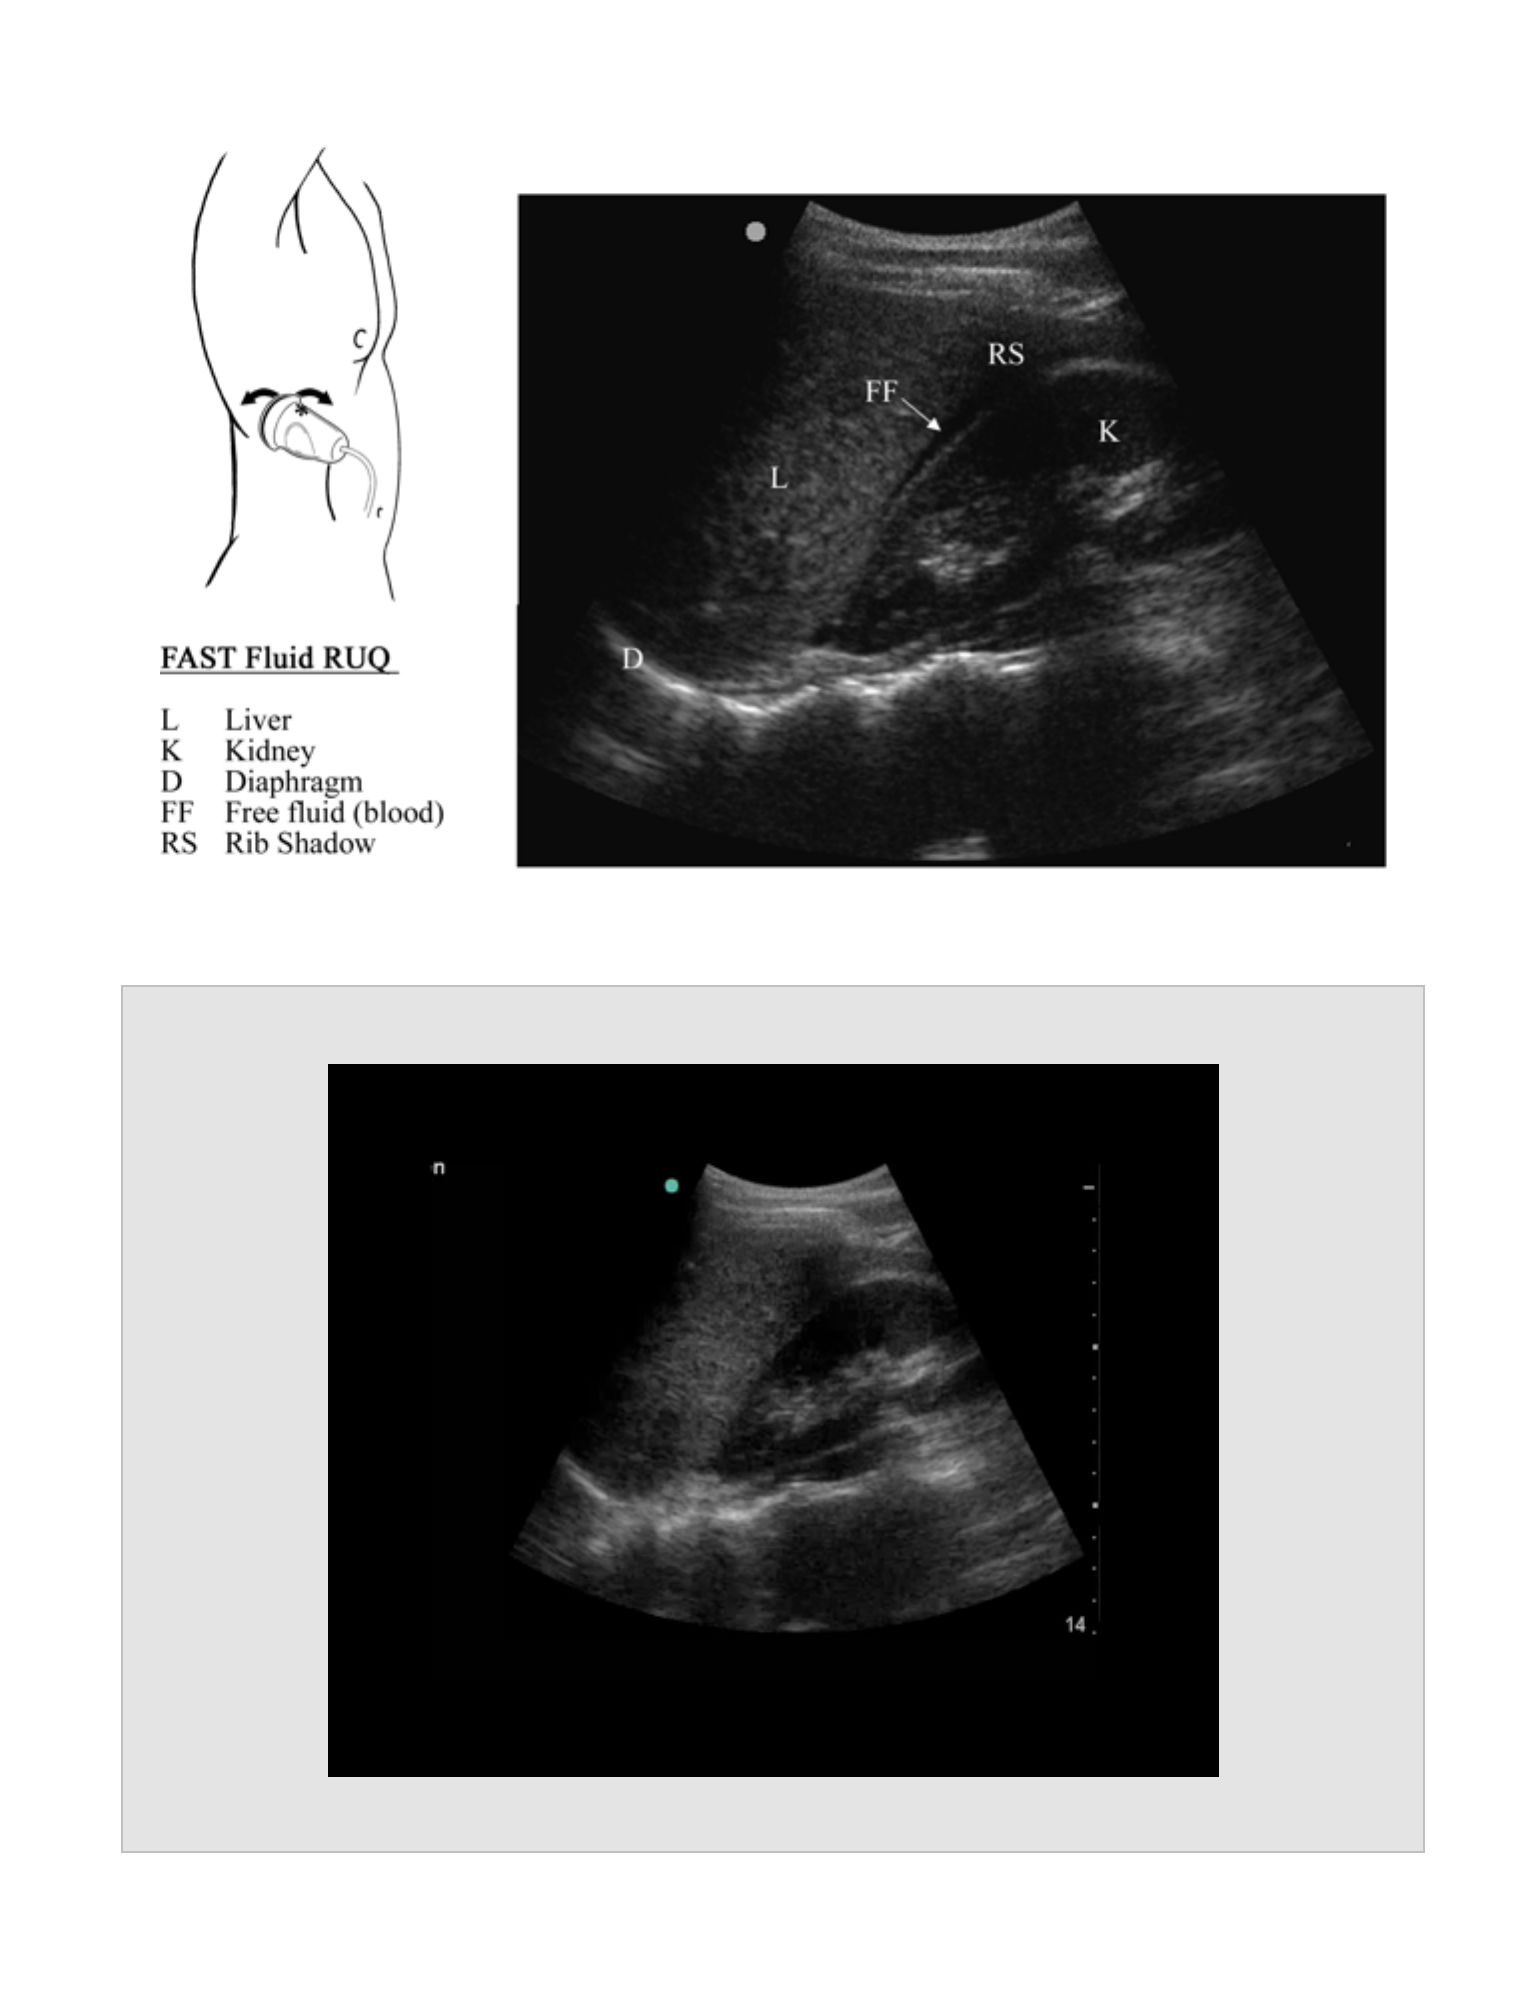
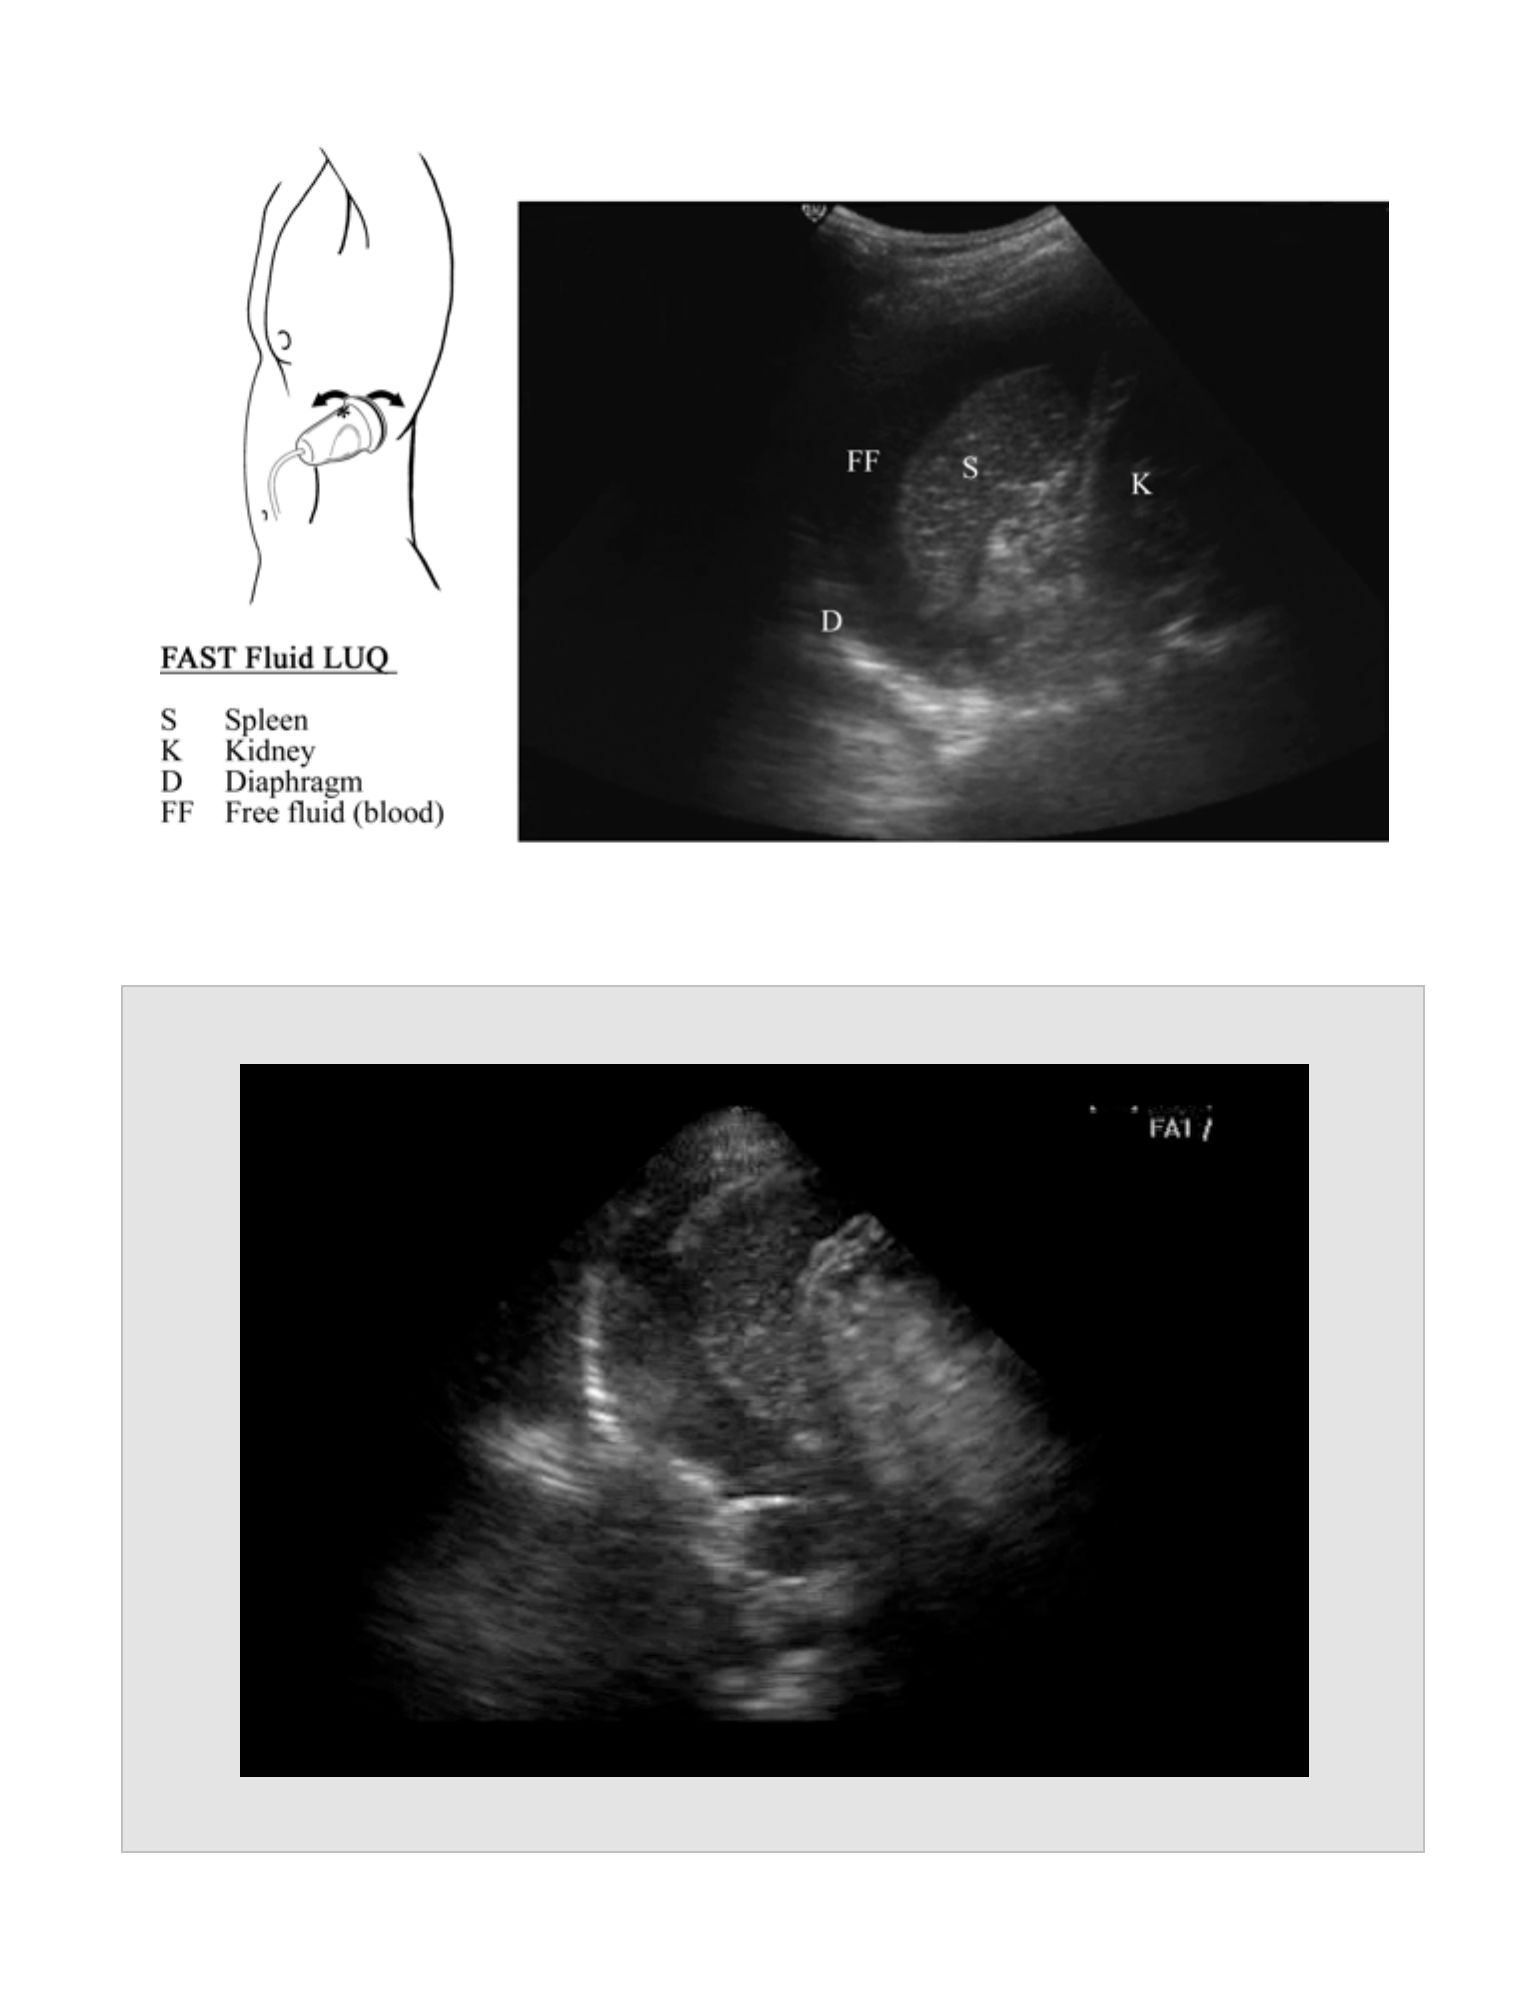
Right Upper Quadrant – Hepatorenal Recess (Morrison’s Pouch)
Probe Placement
•
Right flank between the anterior and mid axillary line, 11th rib interspace with
marker cephalad
Anatomic Structures
•
Visualize the liver and the right kidney and the potential space between the two
organs, the hepatorenal recess (Morrison’s pouch).
•
Visualize the diaphragm at the superior edge of the liver and the right hemithorax
above the diaphragm.
•
Visualize the inferior pole of the right kidney and the right paracolic gutter.
FAST EXAM

Pathology
•
Hypoechoic (black) fluid between the liver and kidney, above the diaphragm in
the thoracic cavity, or at/below the inferior pole of the kidney in the paracolic
gutter
•
The right upper quadrant is the most common location for identification of
intra-abdominal fluid or blood.
•
Placing the patient in Trendelenberg position may increase the sensitivity
of the right upper quadrant (RUQ) view.
•
The width of the stripe in Morrison’s pouch correlates with the amount of
fluid in the abdomen:
•
0.5 cm stripe correlates with approximately 500 ml blood
•
1 cm stripe correlates with approximately 1 liter of blood
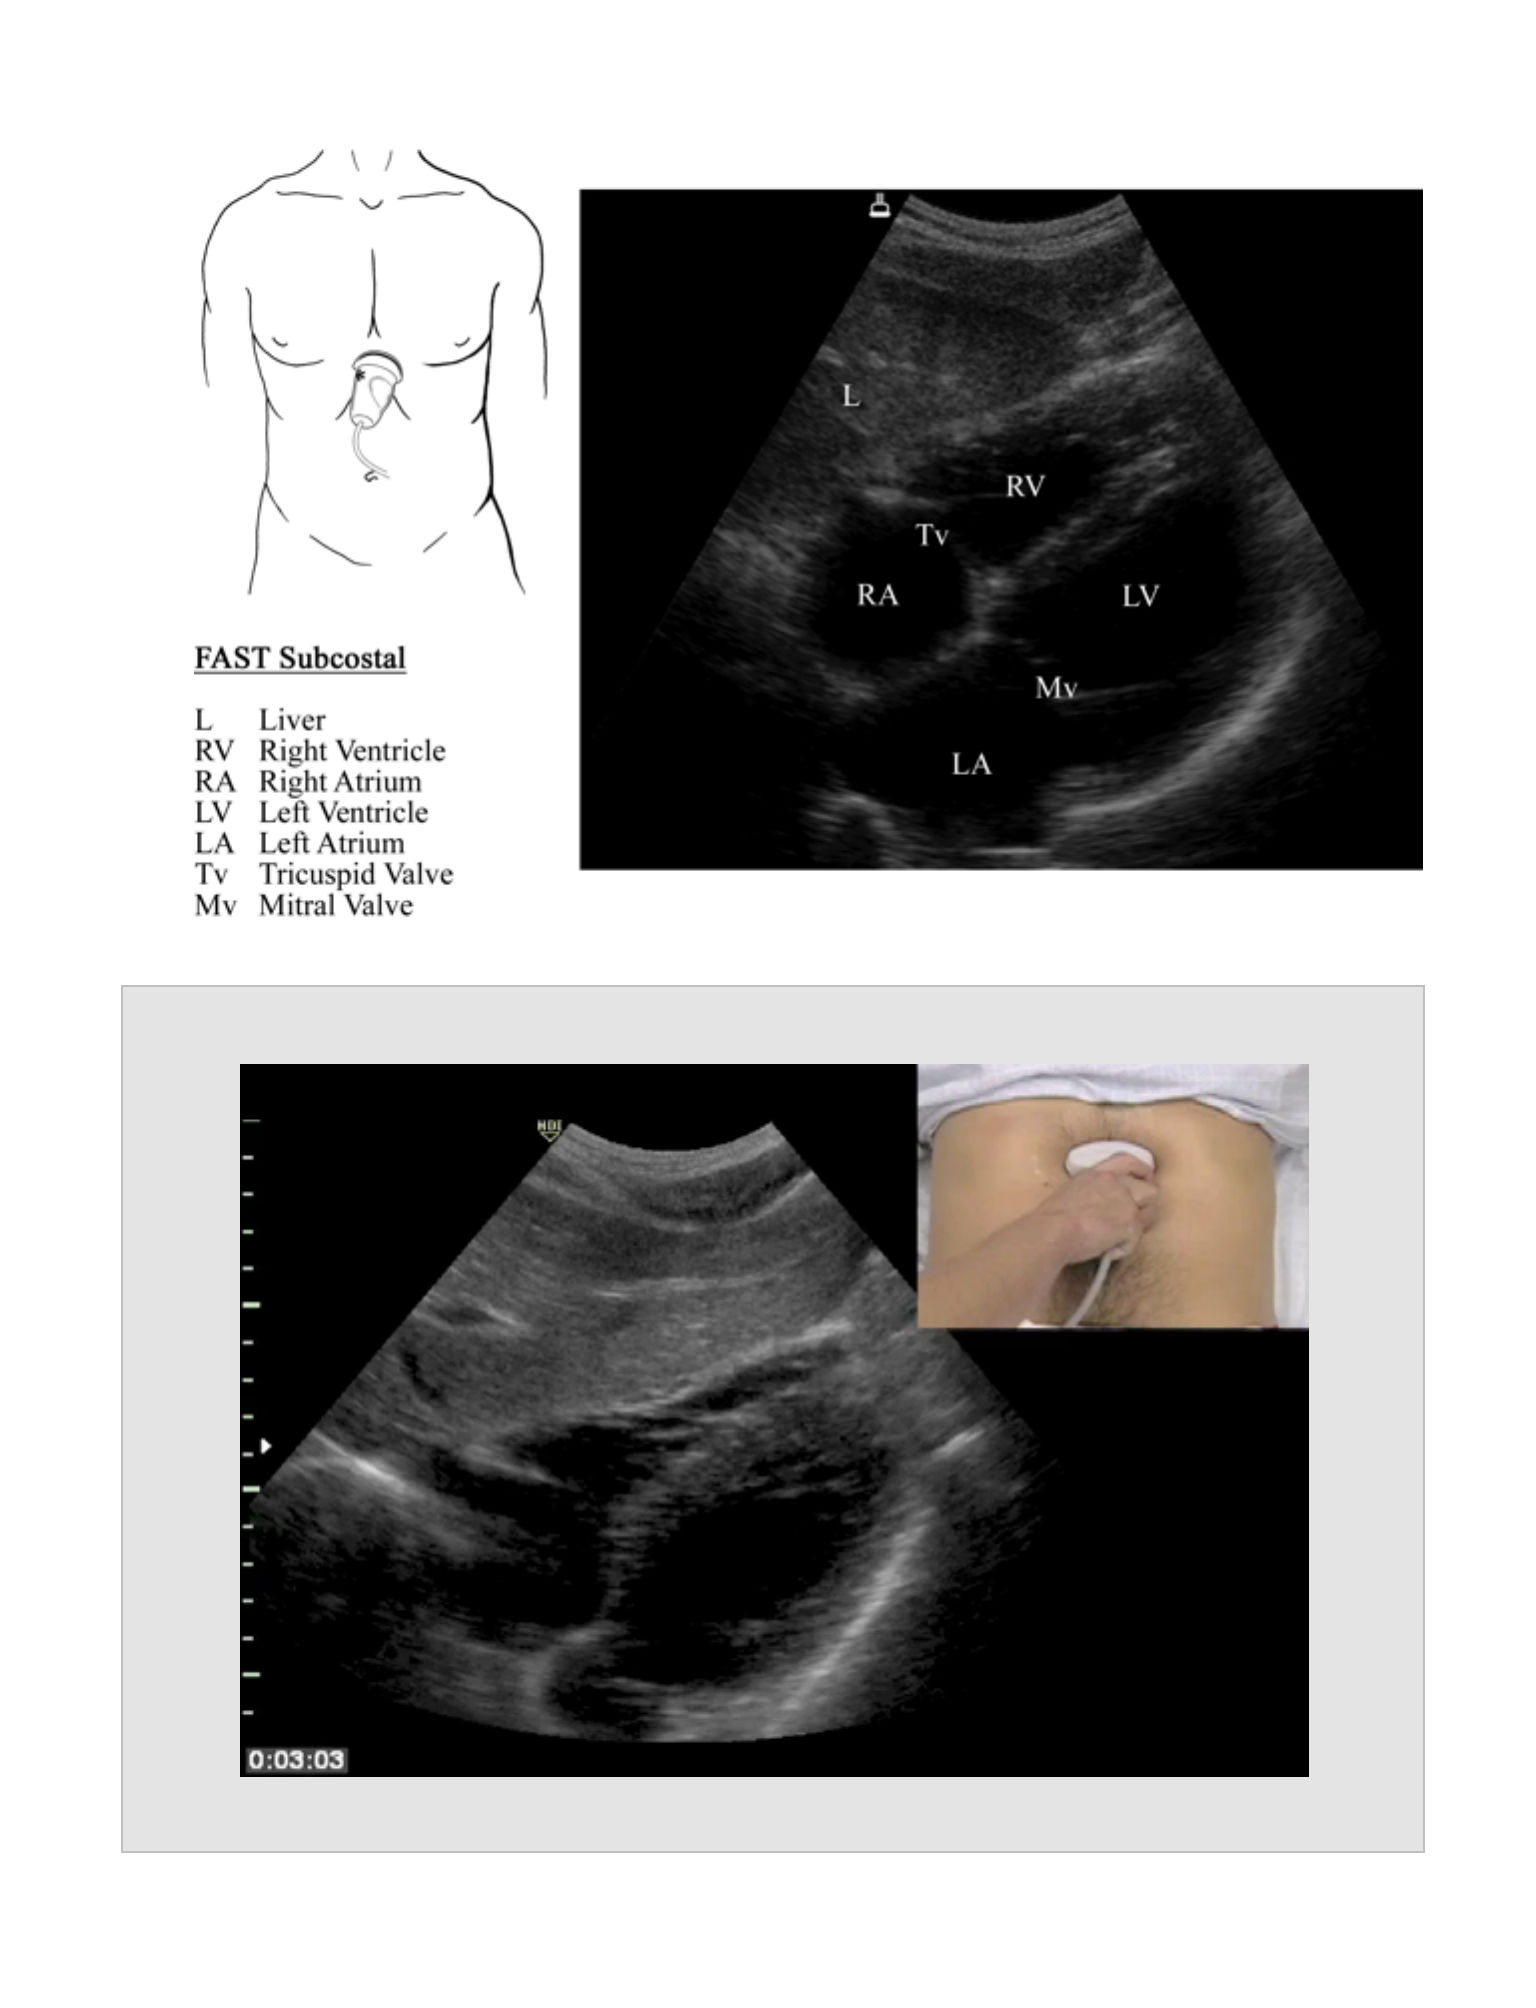
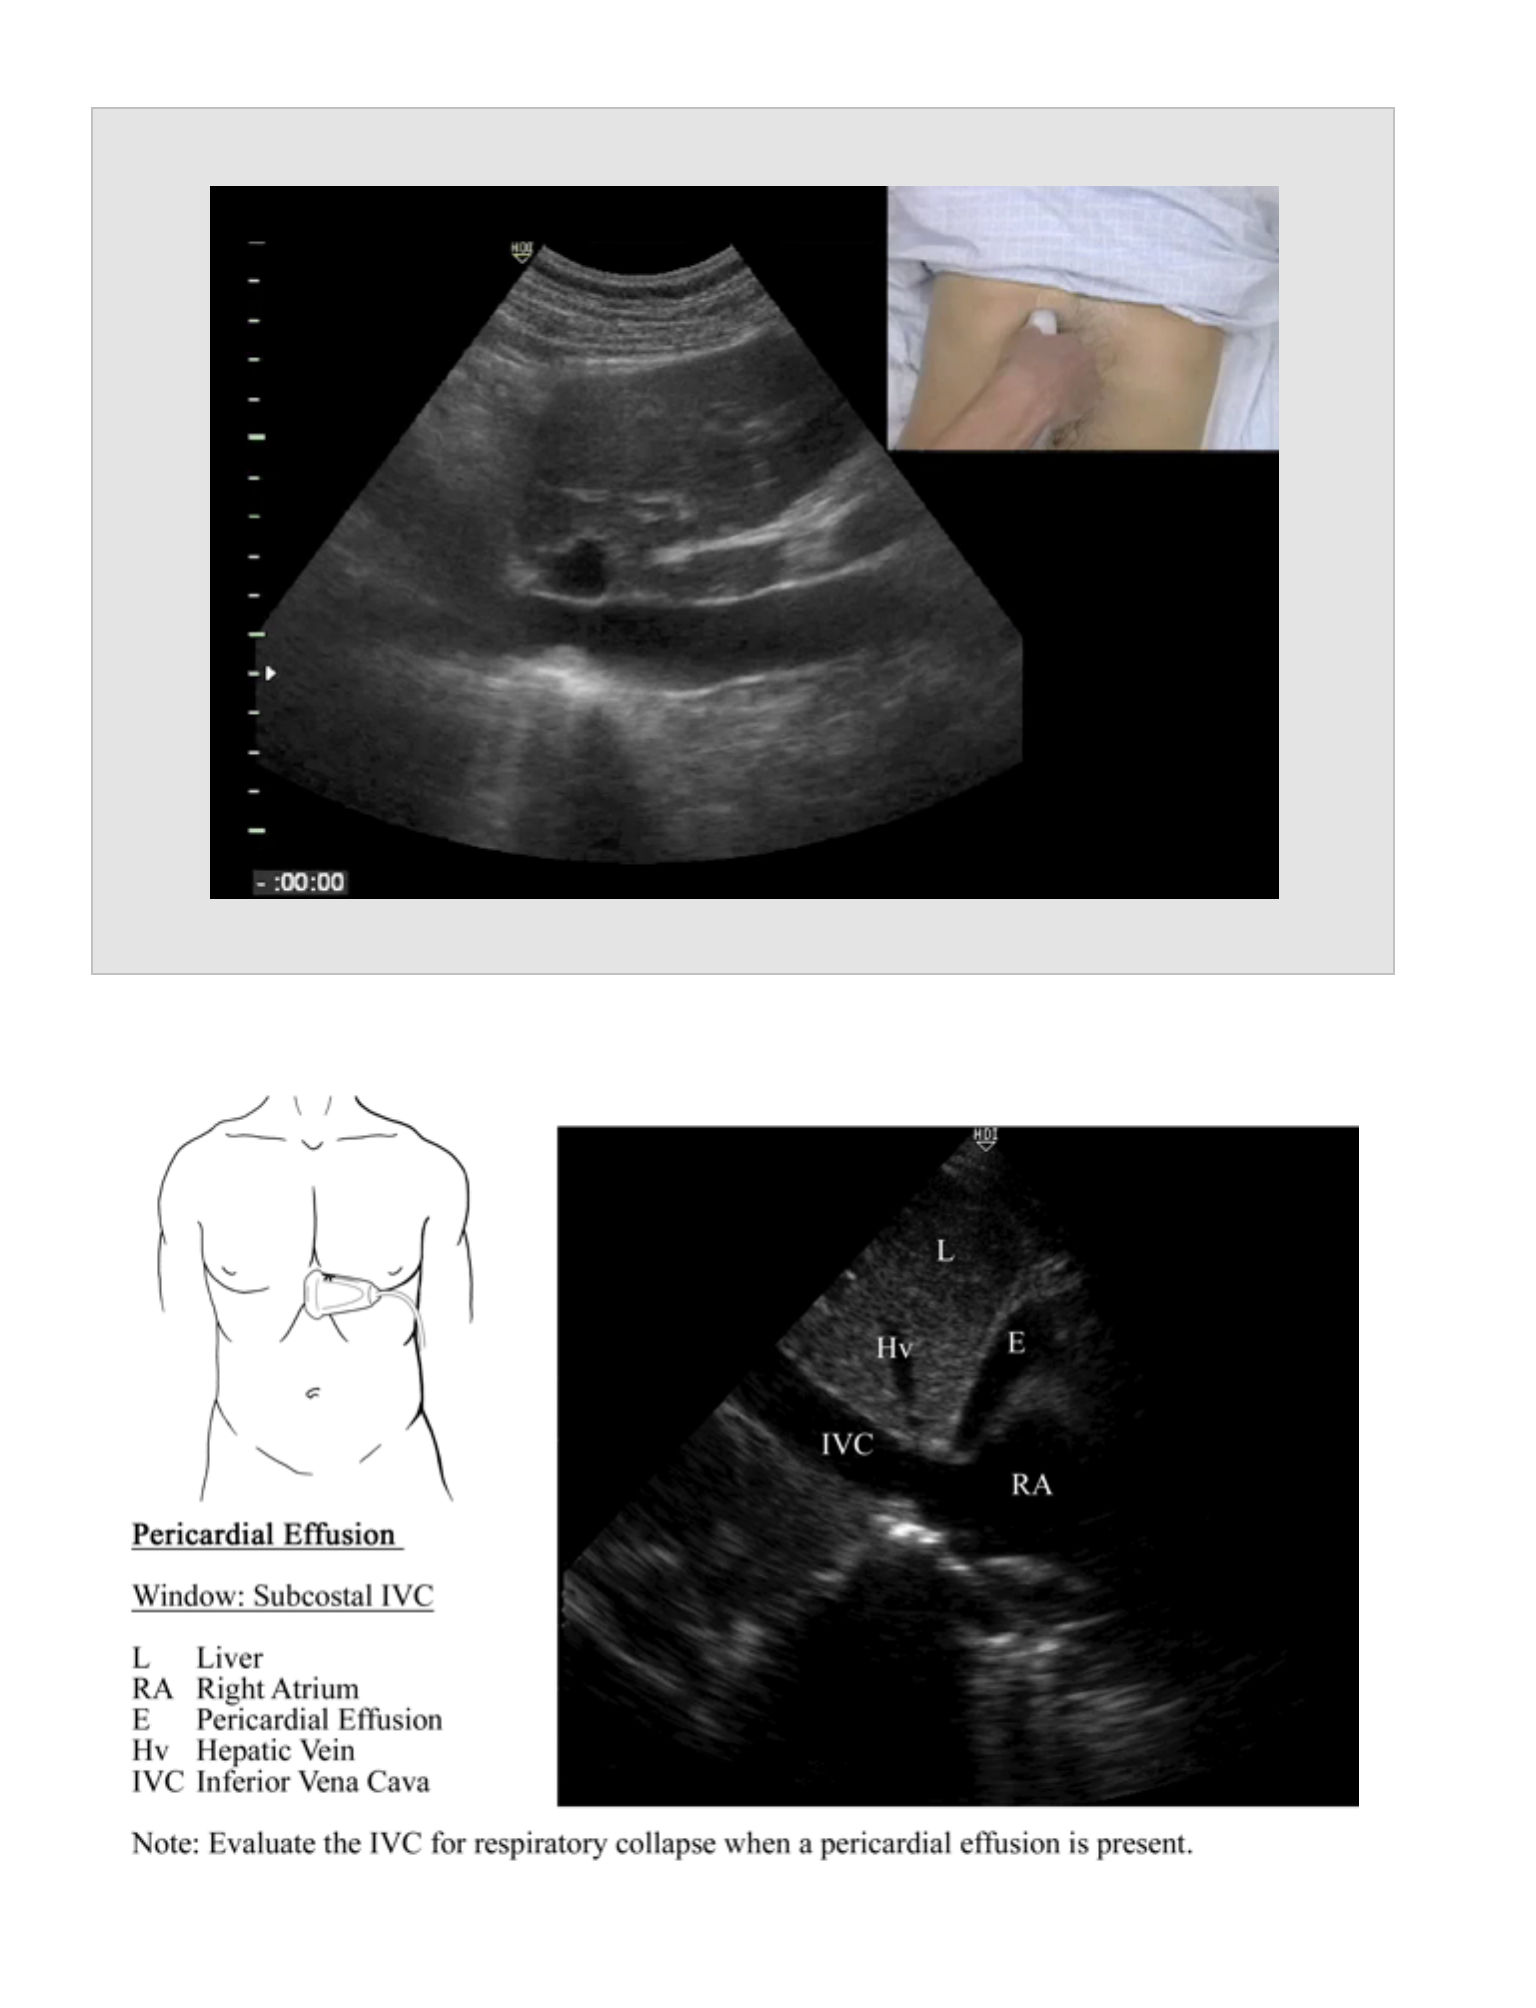
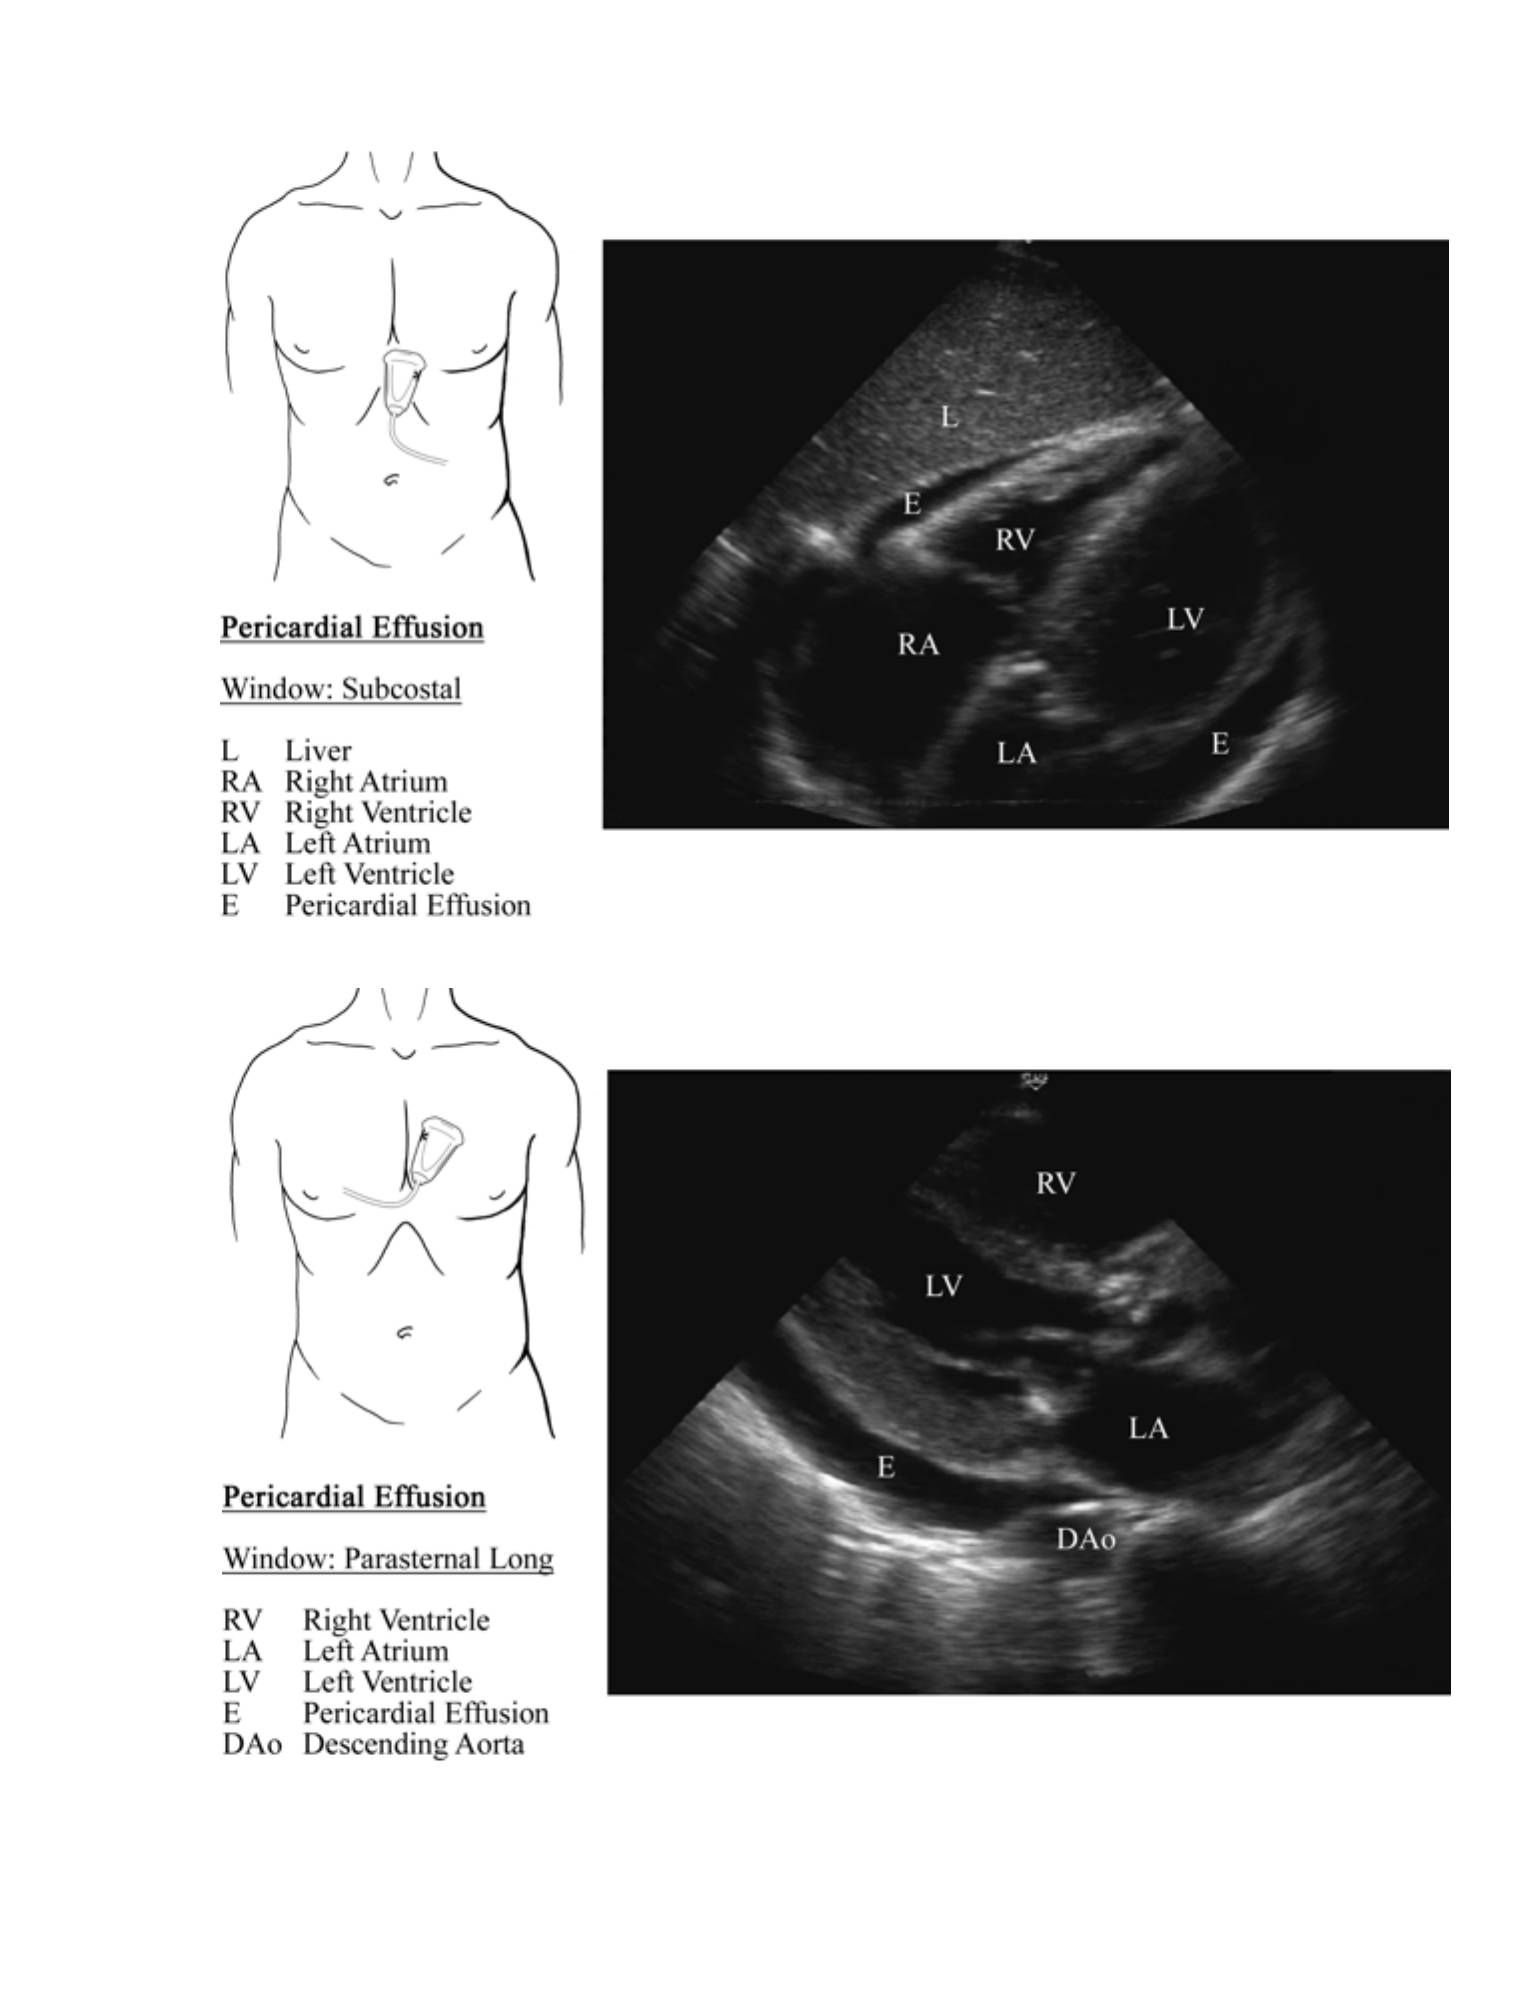
Subcostal
Probe placement
•
Subxiphoid: pointing towards the left shoulder with the marker to the patient’s
right
Anatomic Structures
•
Visualize the heart, pericardial sac, and the potential space between the heart and
pericardium.
Pathology
•
Hypoechoic (black) stripe between the heart and pericardium
•
Slight fluid accumulations that occur rapidly can be hemodynamically
significant. Chronic accumulations of fluid between the heart and
pericardium can be large without causing hemodynamic compromise.
10

•
Evaluate the right ventricular function and the IVC to determine the effect
of a pericardial effusion on cardiac function. (Refer to Extended FAST
Exam)
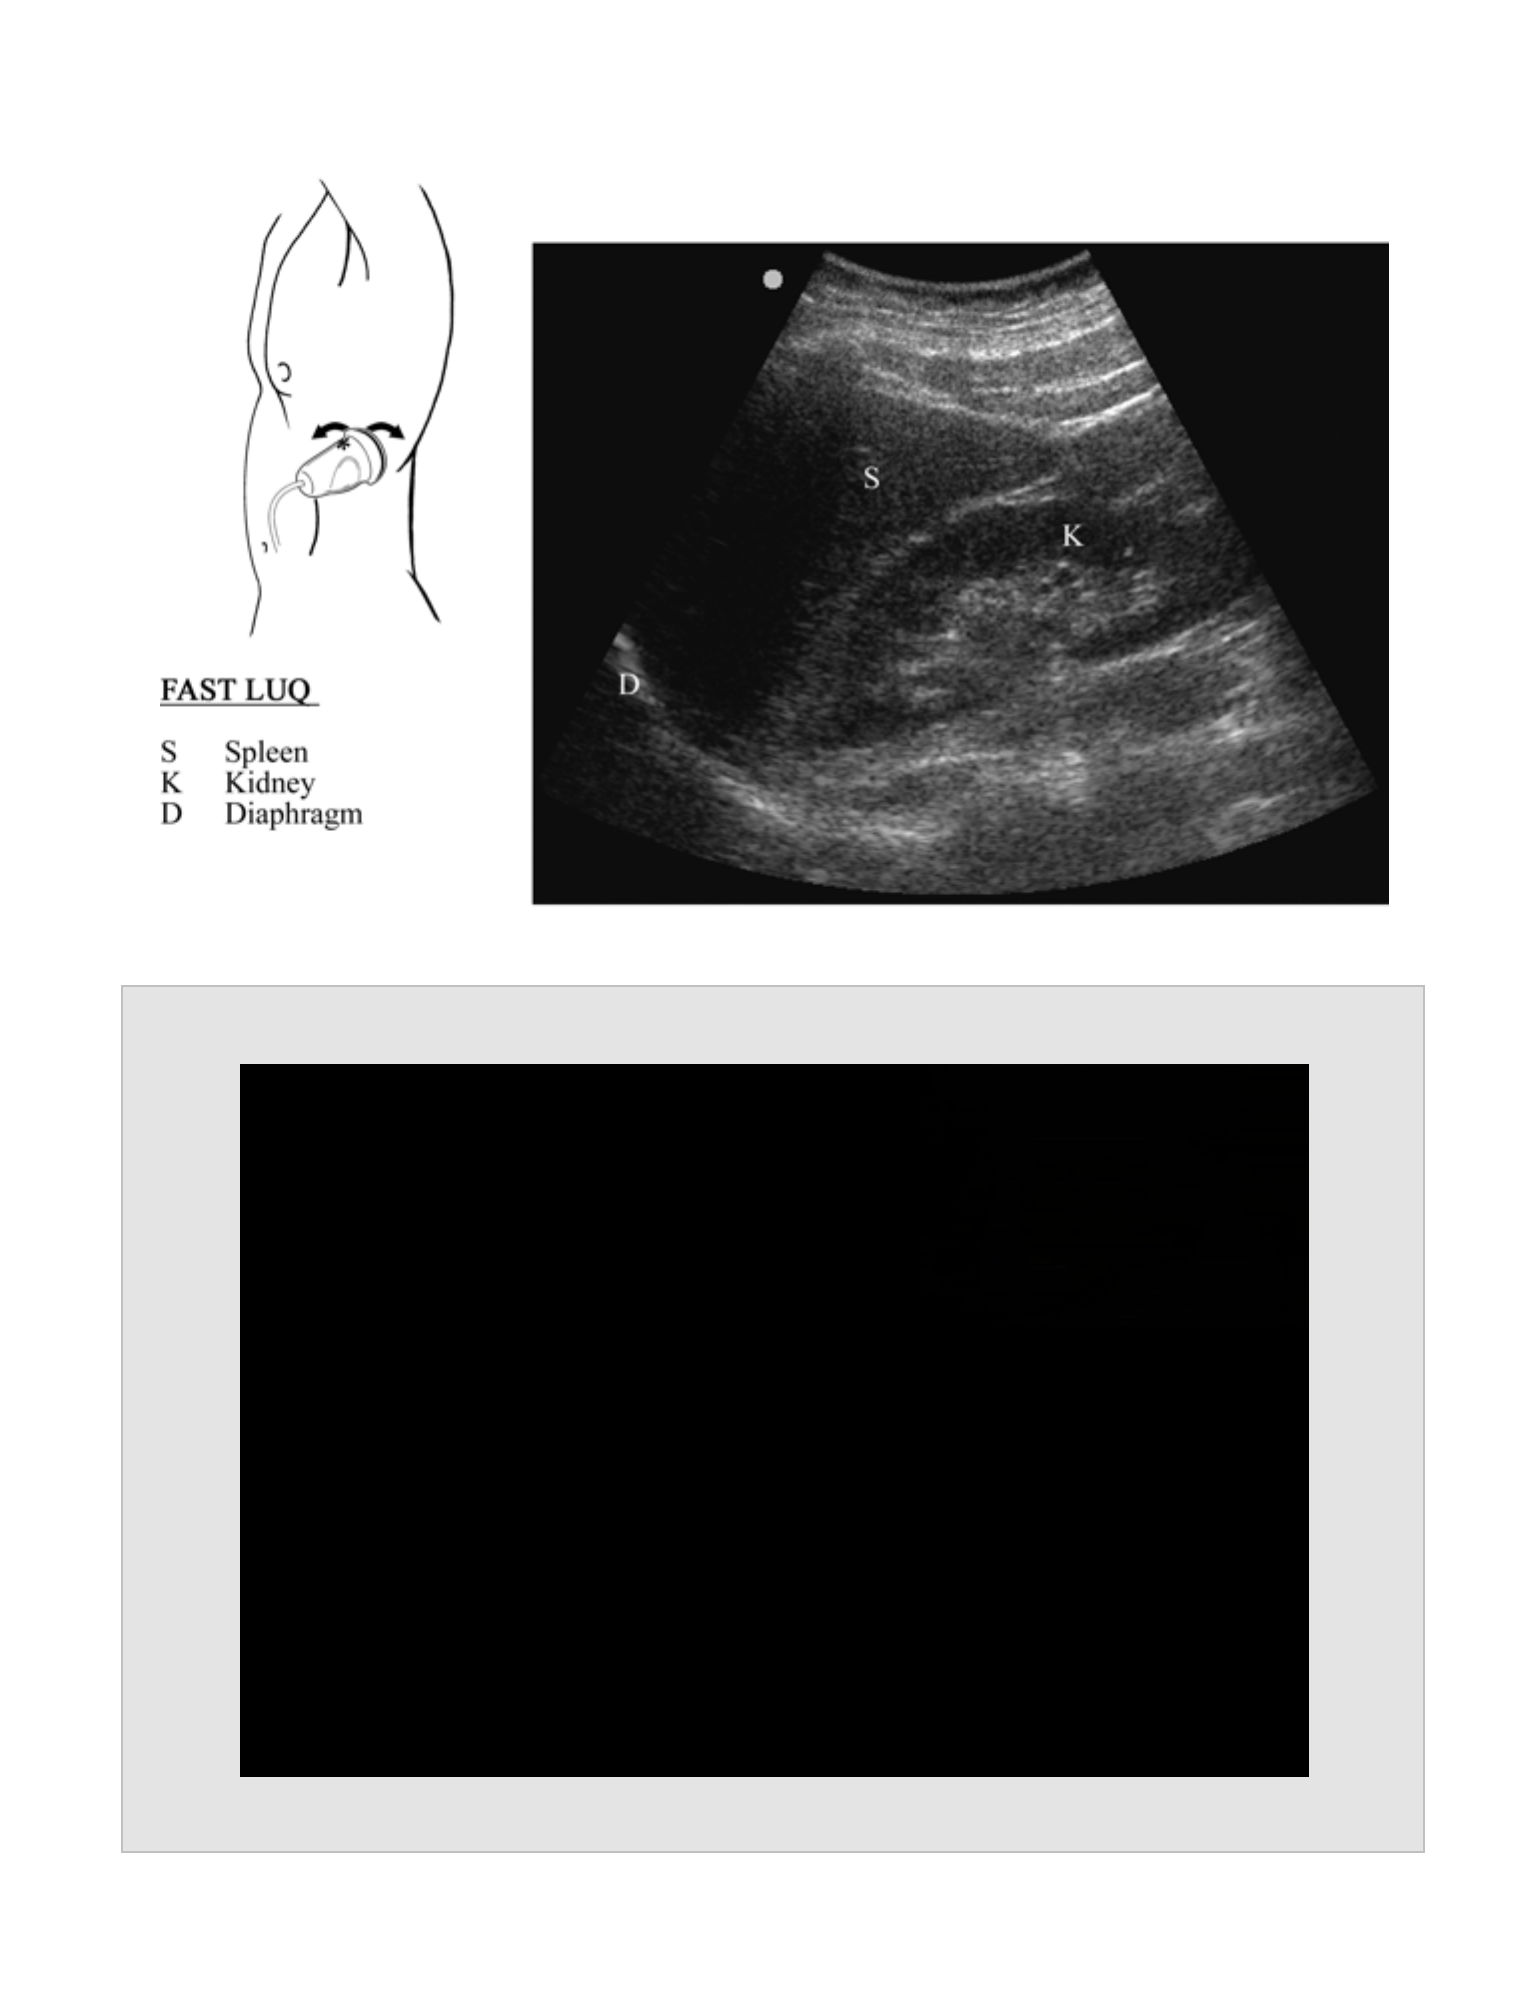
Left Upper Quadrant – Splenorenal space
Probe Placement
•
Left flank between the mid and posterior axillary line, 10th rib interspace with
marker cephalad
Anatomic Structures
•
“Visualize the spleen and the left kidney and the potential space between the
two organs, the splenorenal recess.
•
Visualize the diaphragm at the superior edge of the spleen and the potential
space between the spleen and the diaphragm.
•
Visualize the left hemithorax above the diaphragm.
•
Visualize the inferior pole of the left kidney and the left paracolic gutter.
Pathology
•
Hypoechoic (black) fluid between the spleen and kidney, between the spleen
and the diaphragm, above the diaphragm in the thoracic cavity, or at/below
the inferior pole of the kidney.
•
Fluid most often collects between the diaphragm and the spleen when
present in the left upper quadrant.
•
Blood from a bleeding spleen most often collects in Morrison’s pouch
rather than the splenorenal recess.
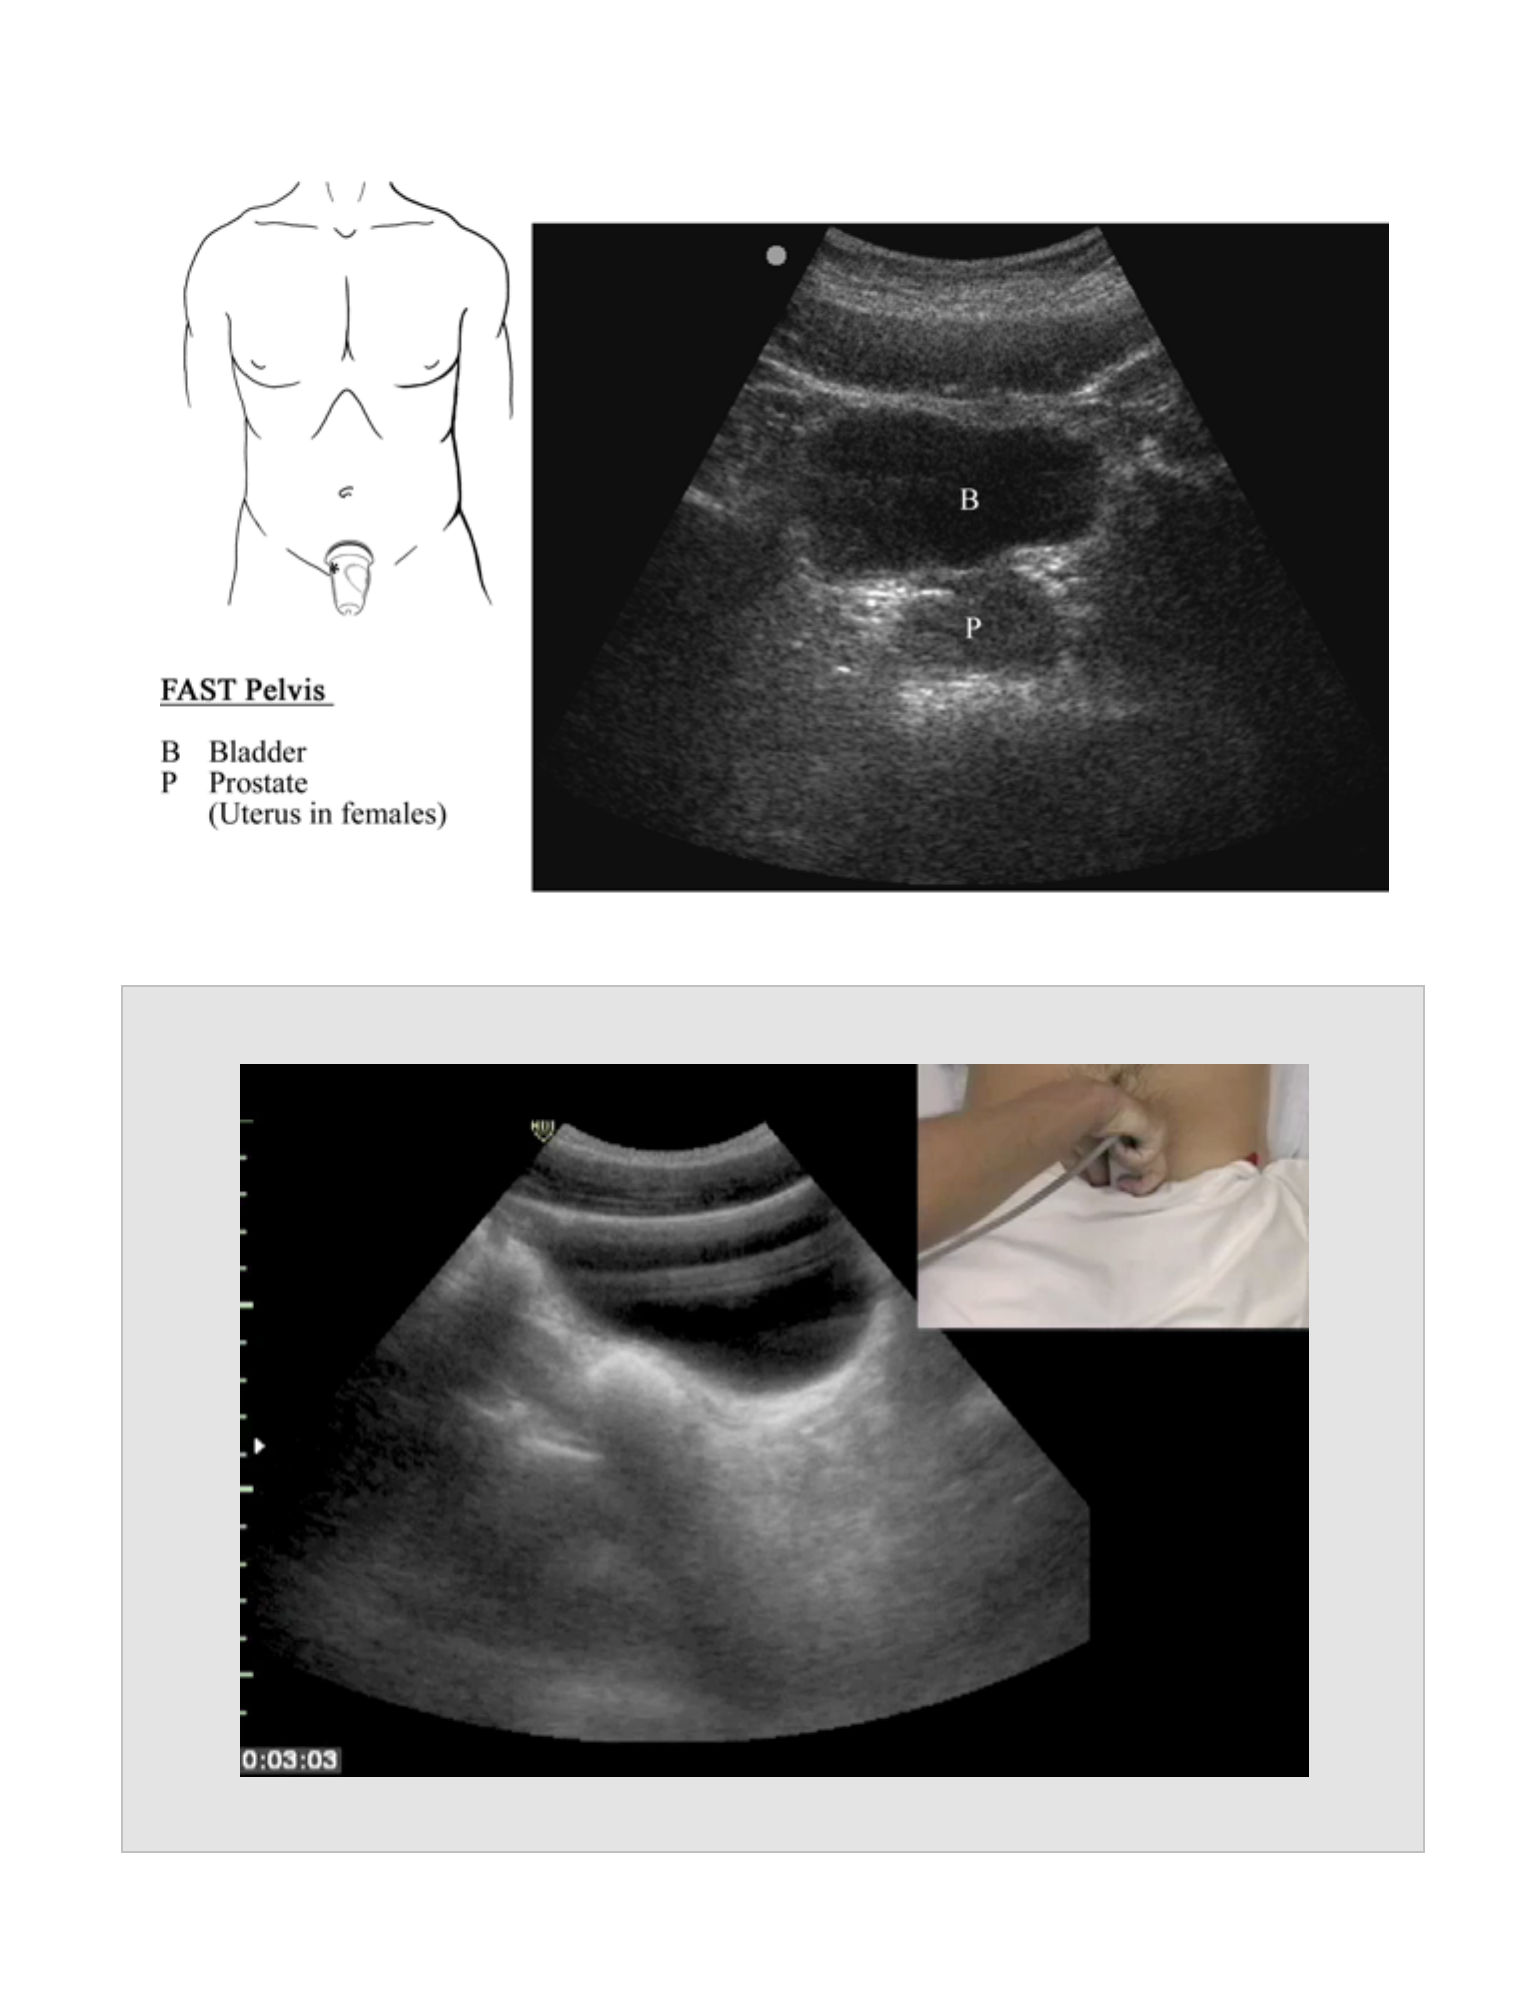
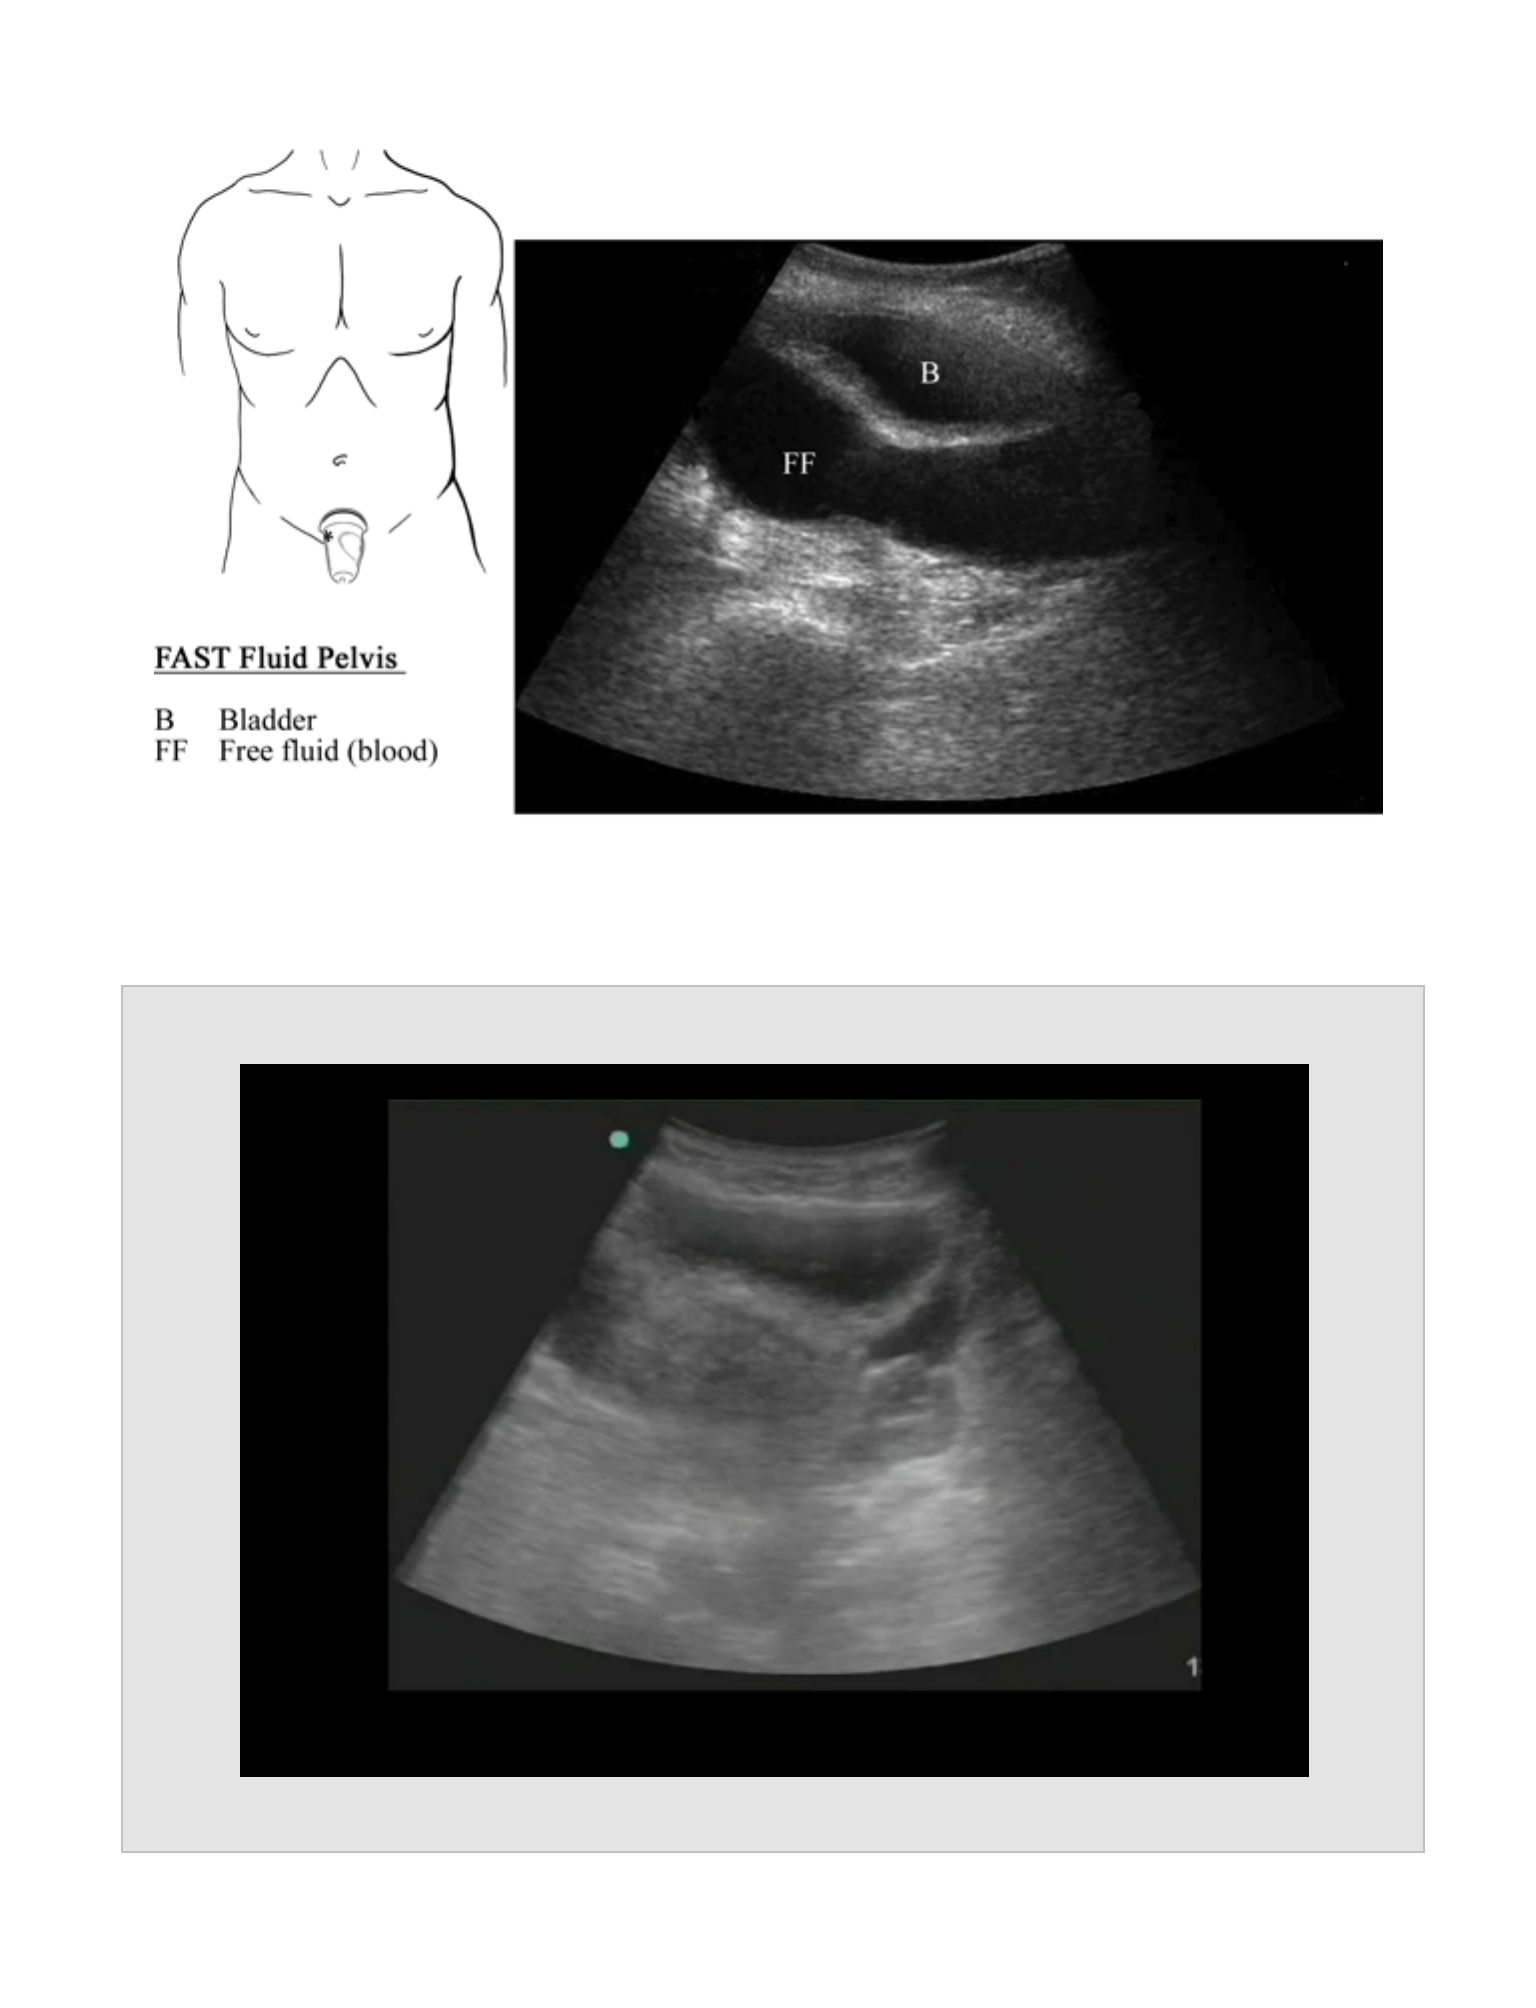
Pelvis
Probe Placement
•
Above pubis angled inferiorly
11

•
Obtain both the transverse view (cross section with marker to the patient’s
right) and the longitudinal view (long axis with marker cephalad).
Anatomic Structures
•
Visualize the hypoechoic (black) bladder with the uterus seen posterior and
superior to the bladder in females and the prostate visible posterior to the
bladder in males.
Pathology
•
Hypoechoic (black) stripe of fluid behind or on either/both sides of the bladder
(or uterus)
•
Use both the longitudinal and cross sectional views of the bladder to
assure the identity of the bladder and differentiate it from intra abdominal
fluid.
•
Care must be taken not to confuse the prostate or uterus with abdominal
fluid.
•
In children, the pelvic view is more often positive than the RUQ view.
Pearls
•
Serial FAST examinations increase the sensitivity of detecting intra-abdominal
injuries.
•
Placing the patient in Trendelenberg may increase the sensitivity of the FAST
exam.
Pitfalls
•
Fluid in the abdomen may not be due to trauma and may not be blood. Clinical
ultrasound cannot determine the etiology of the fluid based solely on the
ultrasound findings. False positive results may be seen in the setting of ascites or
from non-traumatic causes of bleeding such as a hemorrhagic ovarian cyst. An
12
intraperitoneal bladder rupture may release urine into the abdomen that also
cannot be differentiated from intra-abdominal blood.
•
Ultrasound of the abdomen is not capable of imaging the retroperitoneum.
Retroperitoneal bleeding from structures such as the kidneys or the aorta will not
be detected with the FAST exam.
•
Significant solid organ injuries can exist without blood being present in the
peritoneal cavity. The use of ultrasound contrast may increase the sensitivity in
these cases.
•
Bowel injuries may be present despite the lack of significant amounts of free
intraperitoneal fluid (blood or enteric contents).
Reports
•
Morrison’s pouch, sub-xiphoid, splenorenal recess and 2 views of the pelvis
(longitudinal and cross section)
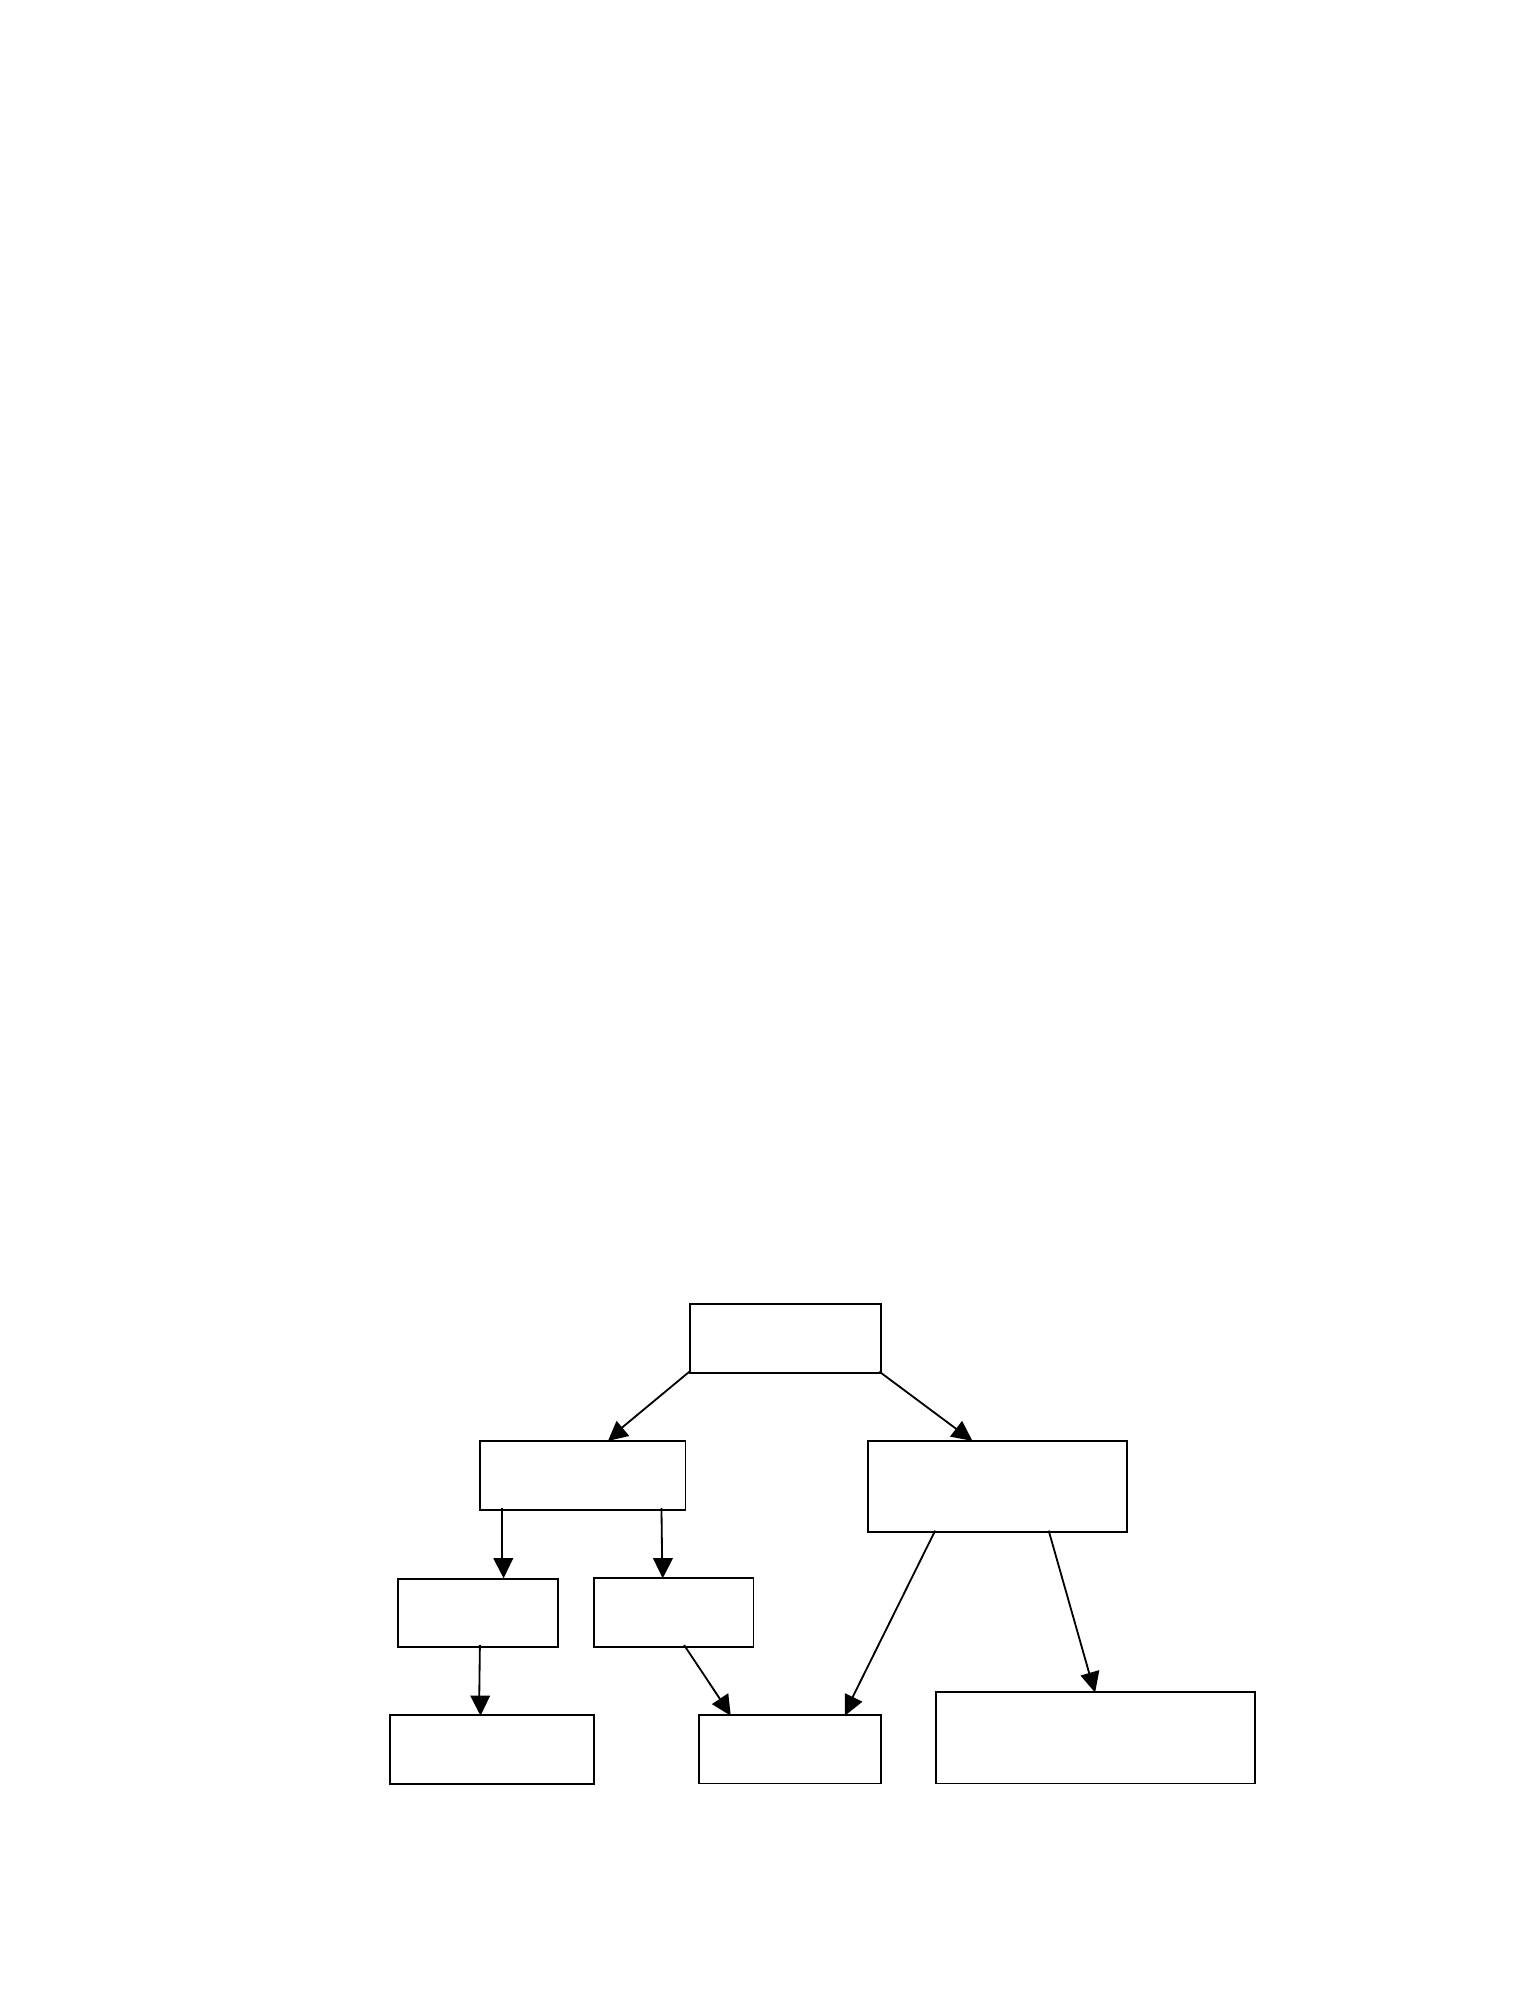
Clinical Integration Diagram
13
FAST Exam
CT scan
No free fluid or
equivocal results
Laparotomy
Free fluid
Stable
Unstable
Consider observation
and/or serial US
14
FAST RUQ
Movie 2.1
15
FAST Cardiac Subcoastal
Movie 2.2
16
FAST LUQ
Movie 2.3
17
FAST Pelvis
Movie 2.4
18
FAST RUQ With Fluid
Movie 2.5
19
FAST LUQ With Fluid
Movie 2.6
20
FAST Pelvis With Fluid
Movie 2.7
Extended Fast Exam

EXTENDED FAST
EXAM
CHAPTER 3
21

22
Indications
•
To more thoroughly evaluate the trauma patient at the bedside
•
To guide resuscitative efforts
Goals
•
To visualize the pleural interface to evaluate for the presence of a pneumothorax
•
To visualize the inferior vena cava (IVC) as a guide for resuscitation and ongoing
blood loss
Probe
•
Curvilinear probe
•
An abdominal probe with 2-5 MHz frequency range that is typically used for
the FAST exam is a logical choice for the extended FAST exam.
•
Linear probe
•
A linear probe with 4-10 MHz frequency range can also be used to evaluate
the pleural interface.
•
Sector probe
•
A cardiac probe may also be used to evaluate the cardiac function and the
IVC.
Patient Position
•
Supine
Standard Views and Probe Position
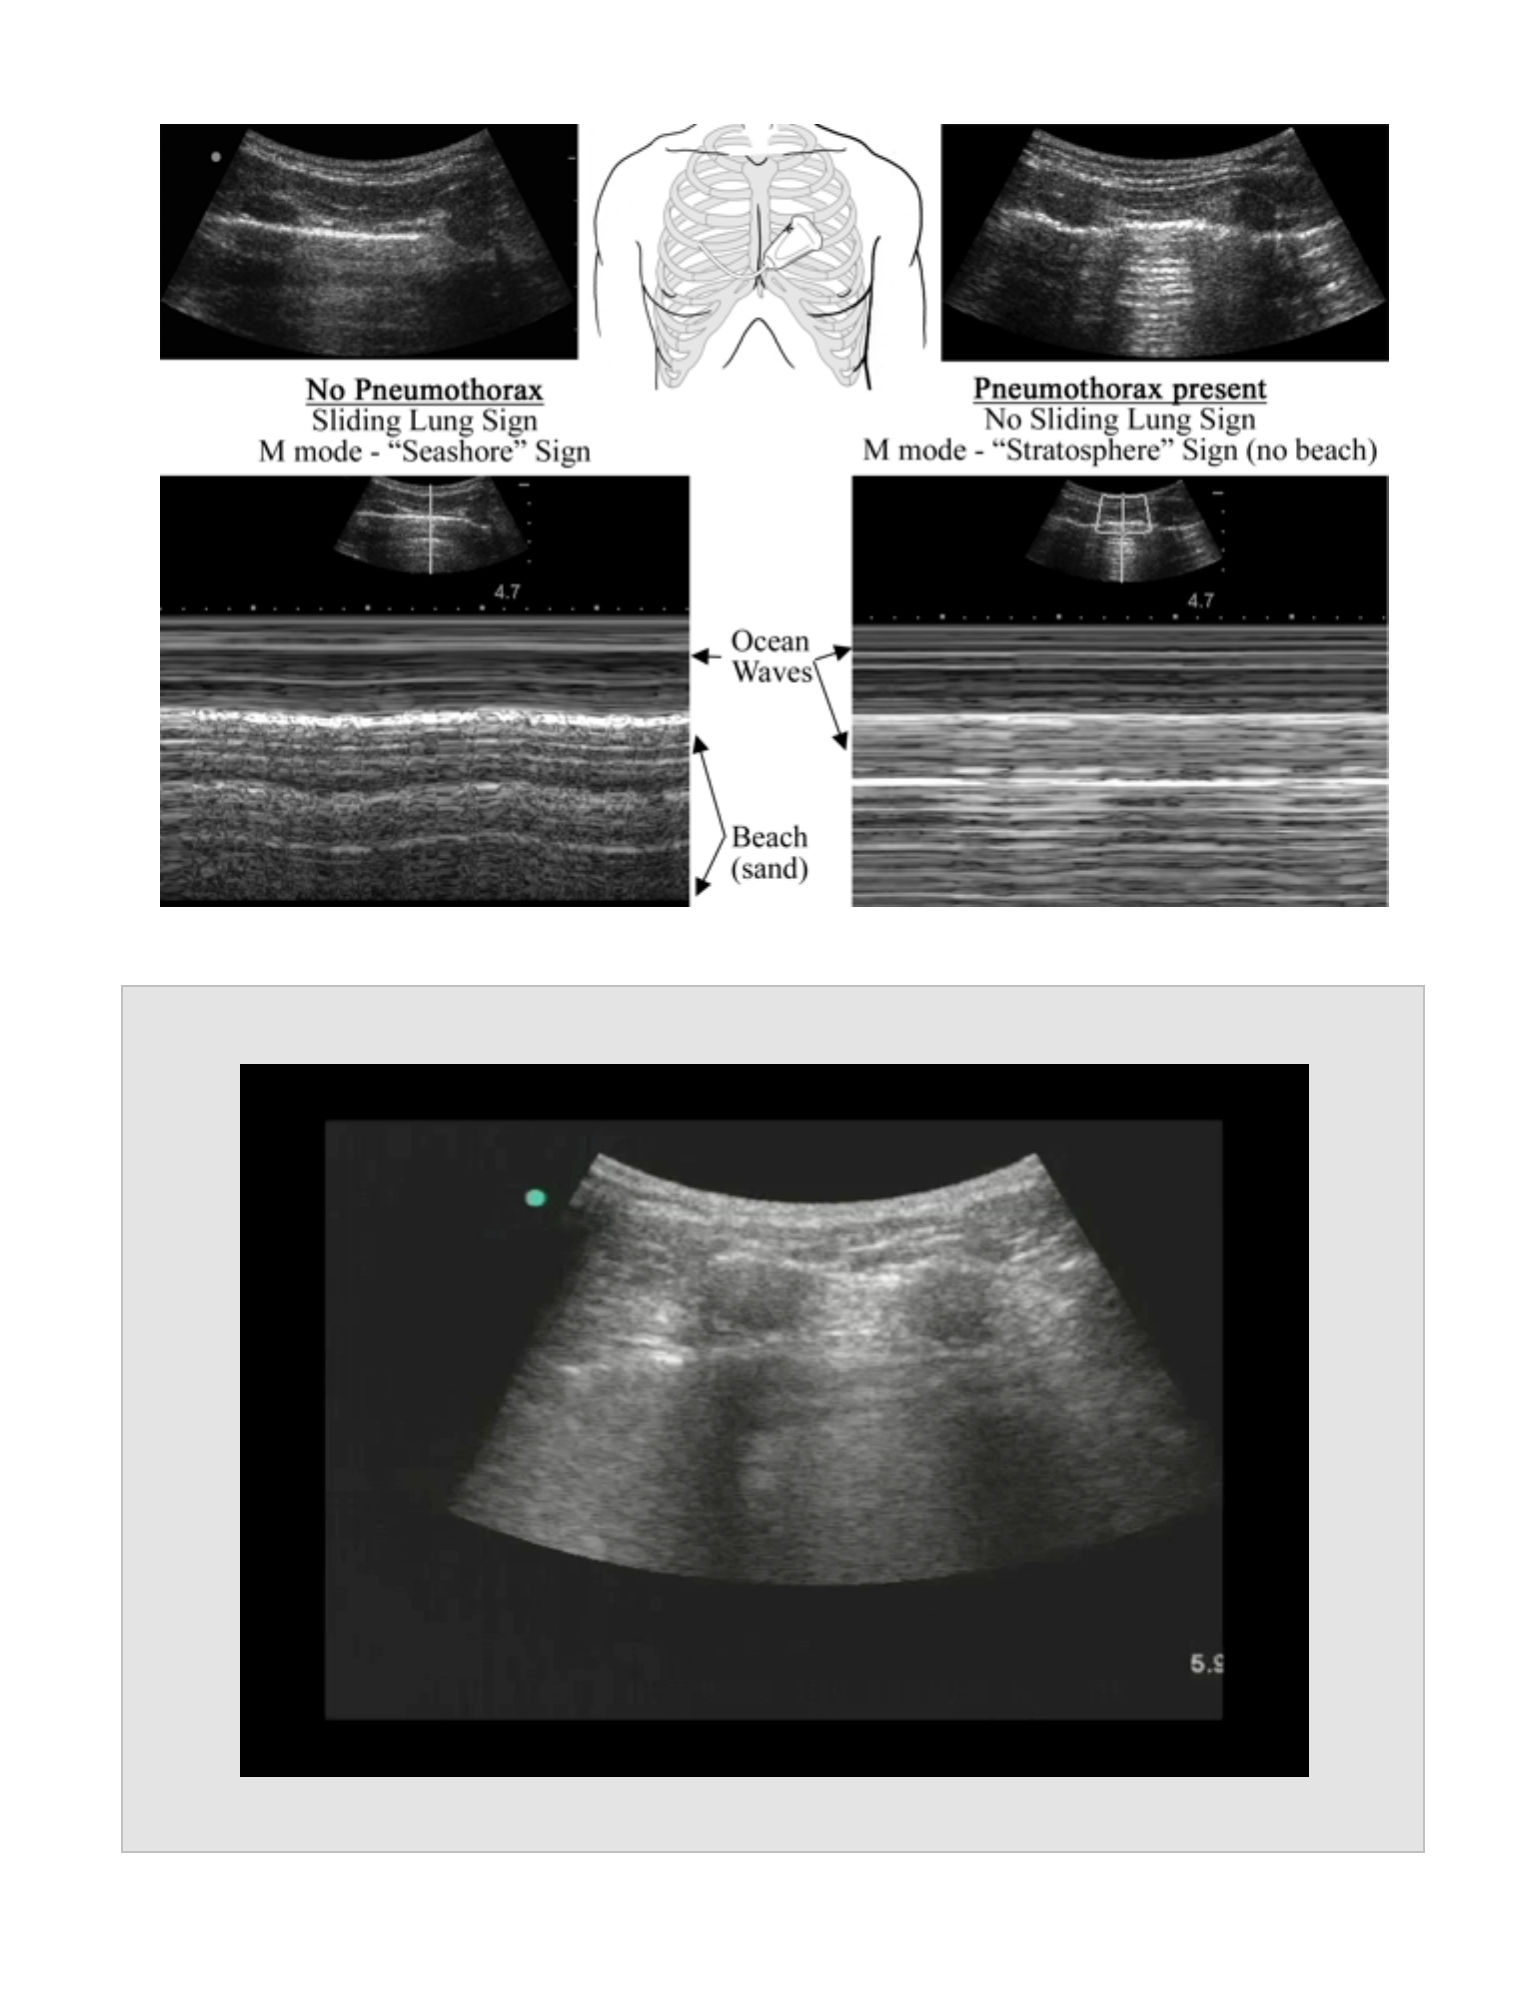
Pleural Interface
•
Probe Placement
•
3rd or 4th intercostal space lateral to the sternum at the most anterior portion of
the chest. Long axis of probe should be transverse to the course of the ribs. The
exam is performed bilaterally.
•
If pneumothorax is suspected, the limits of the pneumothorax should be sought
by following the rib margin laterally until the "lung point" is found.
•
Anatomic Structures
•
Visualize the pleural interface as two adjacent echogenic surfaces sliding relative
to one another with respiration.
EXTENDED FAST EXAM

Pathology
•
Normal lung
•
Sliding Lung Sign
•
Two echogenic pleural lines sliding with respiration and with heart motion
•
M-Mode
•
Seashore Sign
•
Using M-Mode, the soft tissue and the pleural structures appear as
horizontal lines. Deep to the pleura, the lung on the M-mode display
will appear as static or sand on a beach. This has been named the
Seashore Sign because the horizontal lines resemble ocean waves
and the static resembles sand on the beach.
•
$Power Doppler
•
Color will be visible at the pleural interface due to the relative motion of
the pleural surfaces.
•
Pneumothorax
•
No Sliding Lung Sign
•
When a pneumothorax is present, the air will prevent the second (visceral)
pleura from being visualized, and the sliding motion will not be seen.
•
M-Mode
•
Stratosphere Sign (also known as the Barcode Sign)
•
M-mode will produce only horizontal lines, and the sand on the beach
is not seen.
23

•
Power Doppler
•
No color will be present at the pleural interface. By visualizing the normal
pleural interface of the opposite lung, the sonographer can be assured
that the Power Doppler settings are appropriate.
•
Lung Point
•
The point where the pneumothorax ends and normal sliding lung is seen
adjacent to non-sliding lung
•
This is 100% specific for a pneumothorax.
Inferior Vena Cava view
Probe Placement
•
Rotate from the sub-xiphoid view so the indicator is pointing cephalad and the
probe is directed toward the spine. The inferior vena cava (IVC) will be located
posterior to the liver as it enters the right atrium.
Anatomic Structures
•
The IVC is seen in long axis as it enters the right atrium. The junction of the
hepatic veins with the IVC can serve as a landmark to help differentiate the IVC
from the aorta.
Pathology
•
Normal
•
The IVC normally collapses with inspiration and dilates with expiration. The
amount of collapse is an indication of central venous pressure and circulating
blood volume.
!
24

•
Lack of IVC collapse
•
Indicates a pump problem (cardiogenic shock), outflow obstruction
(pulmonary embolus), impaired cardiac filling (cardiac tamponade), or volume
overload
•
Complete IVC collapse
•
An IVC that collapses completely is consistent with hypovolemia or septic
shock.
Pearls
•
Sliding lung can be difficult to appreciate. The use of M-mode can be very helpful
for confirming the diagnosis. As the presence of bilateral pneumothoraces is rare,
a comparison view can also be made with the opposite lung.
•
Serial measurements of the IVC can be used as a guide to fluid resusitation or for
evaluation of ongoing blood loss
Pitfalls
•
Lung blebs can lead to false positive results using the sliding lung technique.
Reports
•
Left and right sliding lung (preferably using M-Mode)
•
IVC measurements
Clinical Integration Diagram
25
Extended FAST Exam
See FAST Exam
Pneumothorax
Unstable
Stable
Chest-tube
Confirmatory
study
Evaluate IVC
Complete
collapse
Doesn’t
collapse
Treat
hypovolemia
Consider:
- Tamponade
- Overload
- PE
- Outflow
obstruction
Determine cause:
- CT
- Observation
- Surgical consult
26
No Pneumothorax - Sliding Lung Sign with Seashore Sign
Movie 3.1
27
Pneumothorax - No Sliding Lung Sign with Stratosphere or Barcode Sign
Movie 3.2
28
IVC Normal Collapse
Movie 3.3
29
Dilated IVC that does not collapse with respiration
Movie 3.4
Cardiac Exam

CARDIAC EXAM
CHAPTER 4
30

31
Indications
•
Cardiac arrest
•
Pulseless electrical activity
•
Undifferentiated Hypotension
•
Rule out pericardial effusion
•
Noninvasive evaluation of the central venous pressure (CVP) and circulating blood
volume (CBV)
•
Evaluate left ventricular wall motion
Goals
•
To visualize the overall cardiac activity in cardiac arrest situations to guide
resuscitative efforts
•
To evaluate for the presence of pericardial effusion and to determine the effusion's
hemodynamic effects.
•
To evaluate the CVP/CBV by assessing the IVC and, in doing so, differentiate
between various shock states.
•
To evaluate the left ventricular wall motion in patients presenting with cardiac
chest pain
Probe
•
Sector probe
•
A cardiac probe with tissue harmonic capability provides the best images by
maximizing the visualization between the ribs
•
Curvilinear probe
•
An abdominal probe with 2-5 MHz frequency range may be used, particularly
in the subcostal view, to visualize overall cardiac function and assess for
effusion.
Patient Position
•
Place the patient in a supine position, particularly for the evaluation of the IVC.
•
The left lateral decubitus position may be useful for bringing the heart closer to
the chest wall and improving the cardiac window.
CARDIAC EXAM

Standard Views and Probe Position
Subcostal
Probe Placement
•
Subxiphoid, pointing towards the left shoulder with the marker to the patient's left
(using cardiac settings); the marker is to the patient's right using abdominal
settings.
Anatomic Structures
•
Visualize the liver and the adjacent right ventricle.
•
Visualize the tricuspid valve between the right ventricle and the right atrium. The
left ventricle may be seen posterior to the right ventricle.
Pathology
•
This is the best view for evaluation of cardiac motion during a code situation.
•
Right atrial dilation, if acute, can indicate a massive pulmonary embolism.
•
Pericardial effusion will be best seen at the IVC-right atrial junction as a
hypoechoic (black) stripe of fluid.
Subcostal IVC view
Probe Placement
•
Rotate from the subxiphoid view so the indicator is pointed towards the head and
the probe is pointing toward the spine. The IVC will be located posterior to the
liver entering the right atrium.
Anatomic Structures
•
The IVC is seen in long axis as it enters the right atrium. The junction of the
hepatic veins with the IVC can serve as a landmark to help differentiate the IVC
from the aorta.
32

Pathology
•
Normal
•
The IVC normally collapses with inspiration and dilates with expiration. The
amount of collapse is an indication of central venous pressure and circulating
blood volume.
•
Lack of IVC collapse
•
Indicates a pump problem (cardiogenic shock), outflow obstruction
(pulmonary embolus), impaired cardiac filling (cardiac tamponade), or volume
overload.
•
Complete IVC collapse
•
An IVC that collapses completely is consistent with hypovolemia or septic
shock.
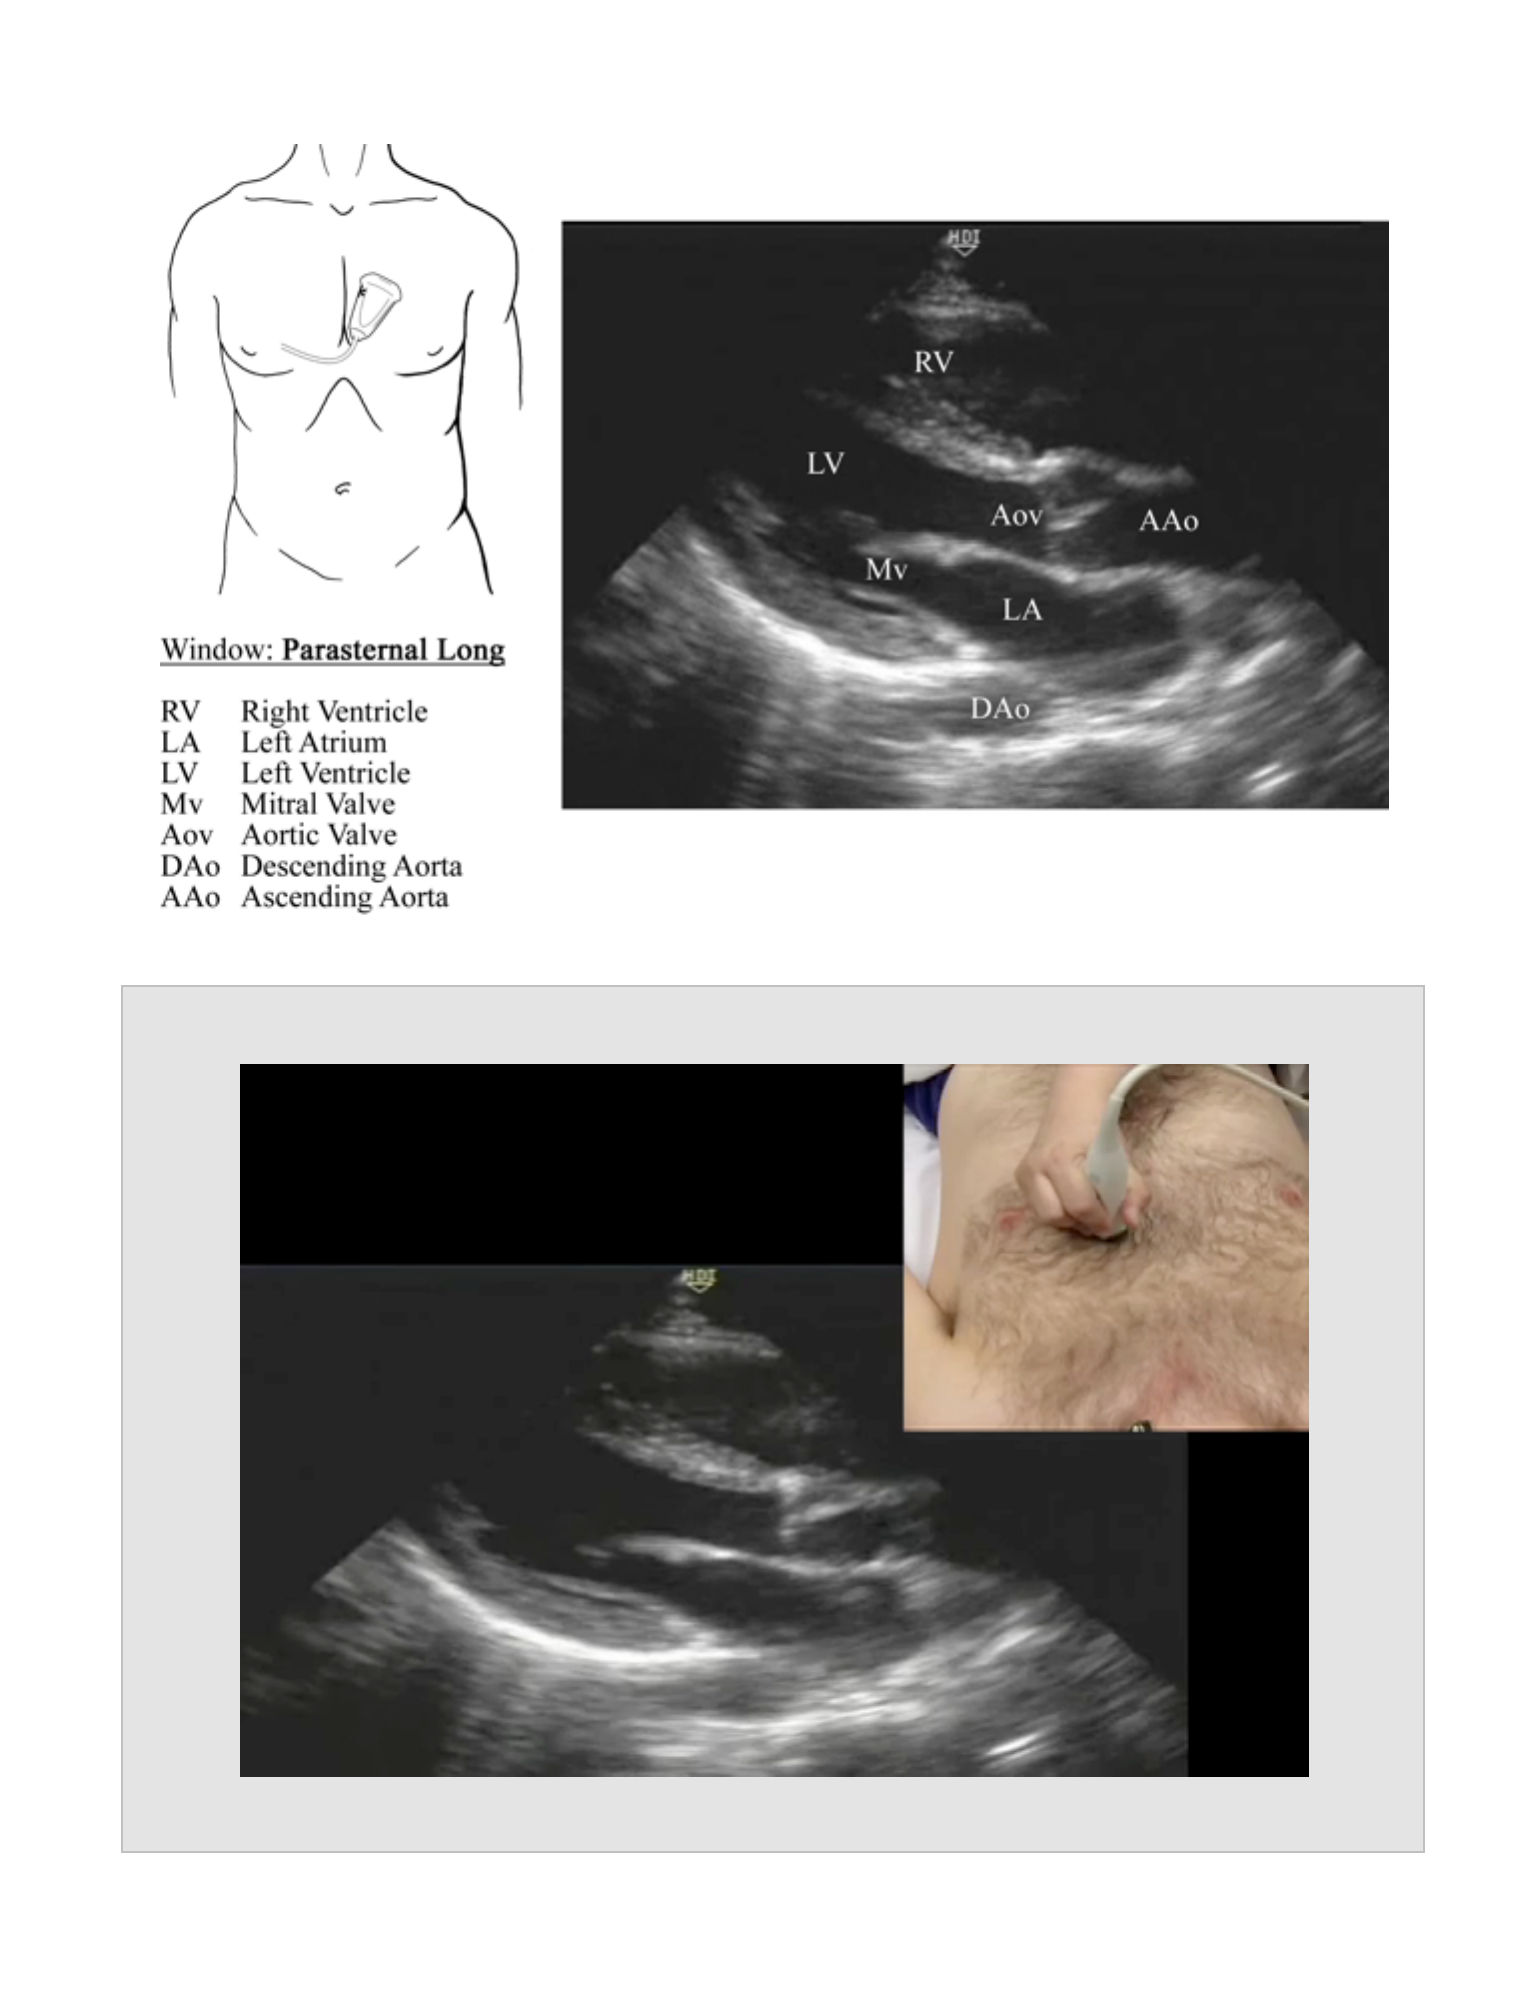
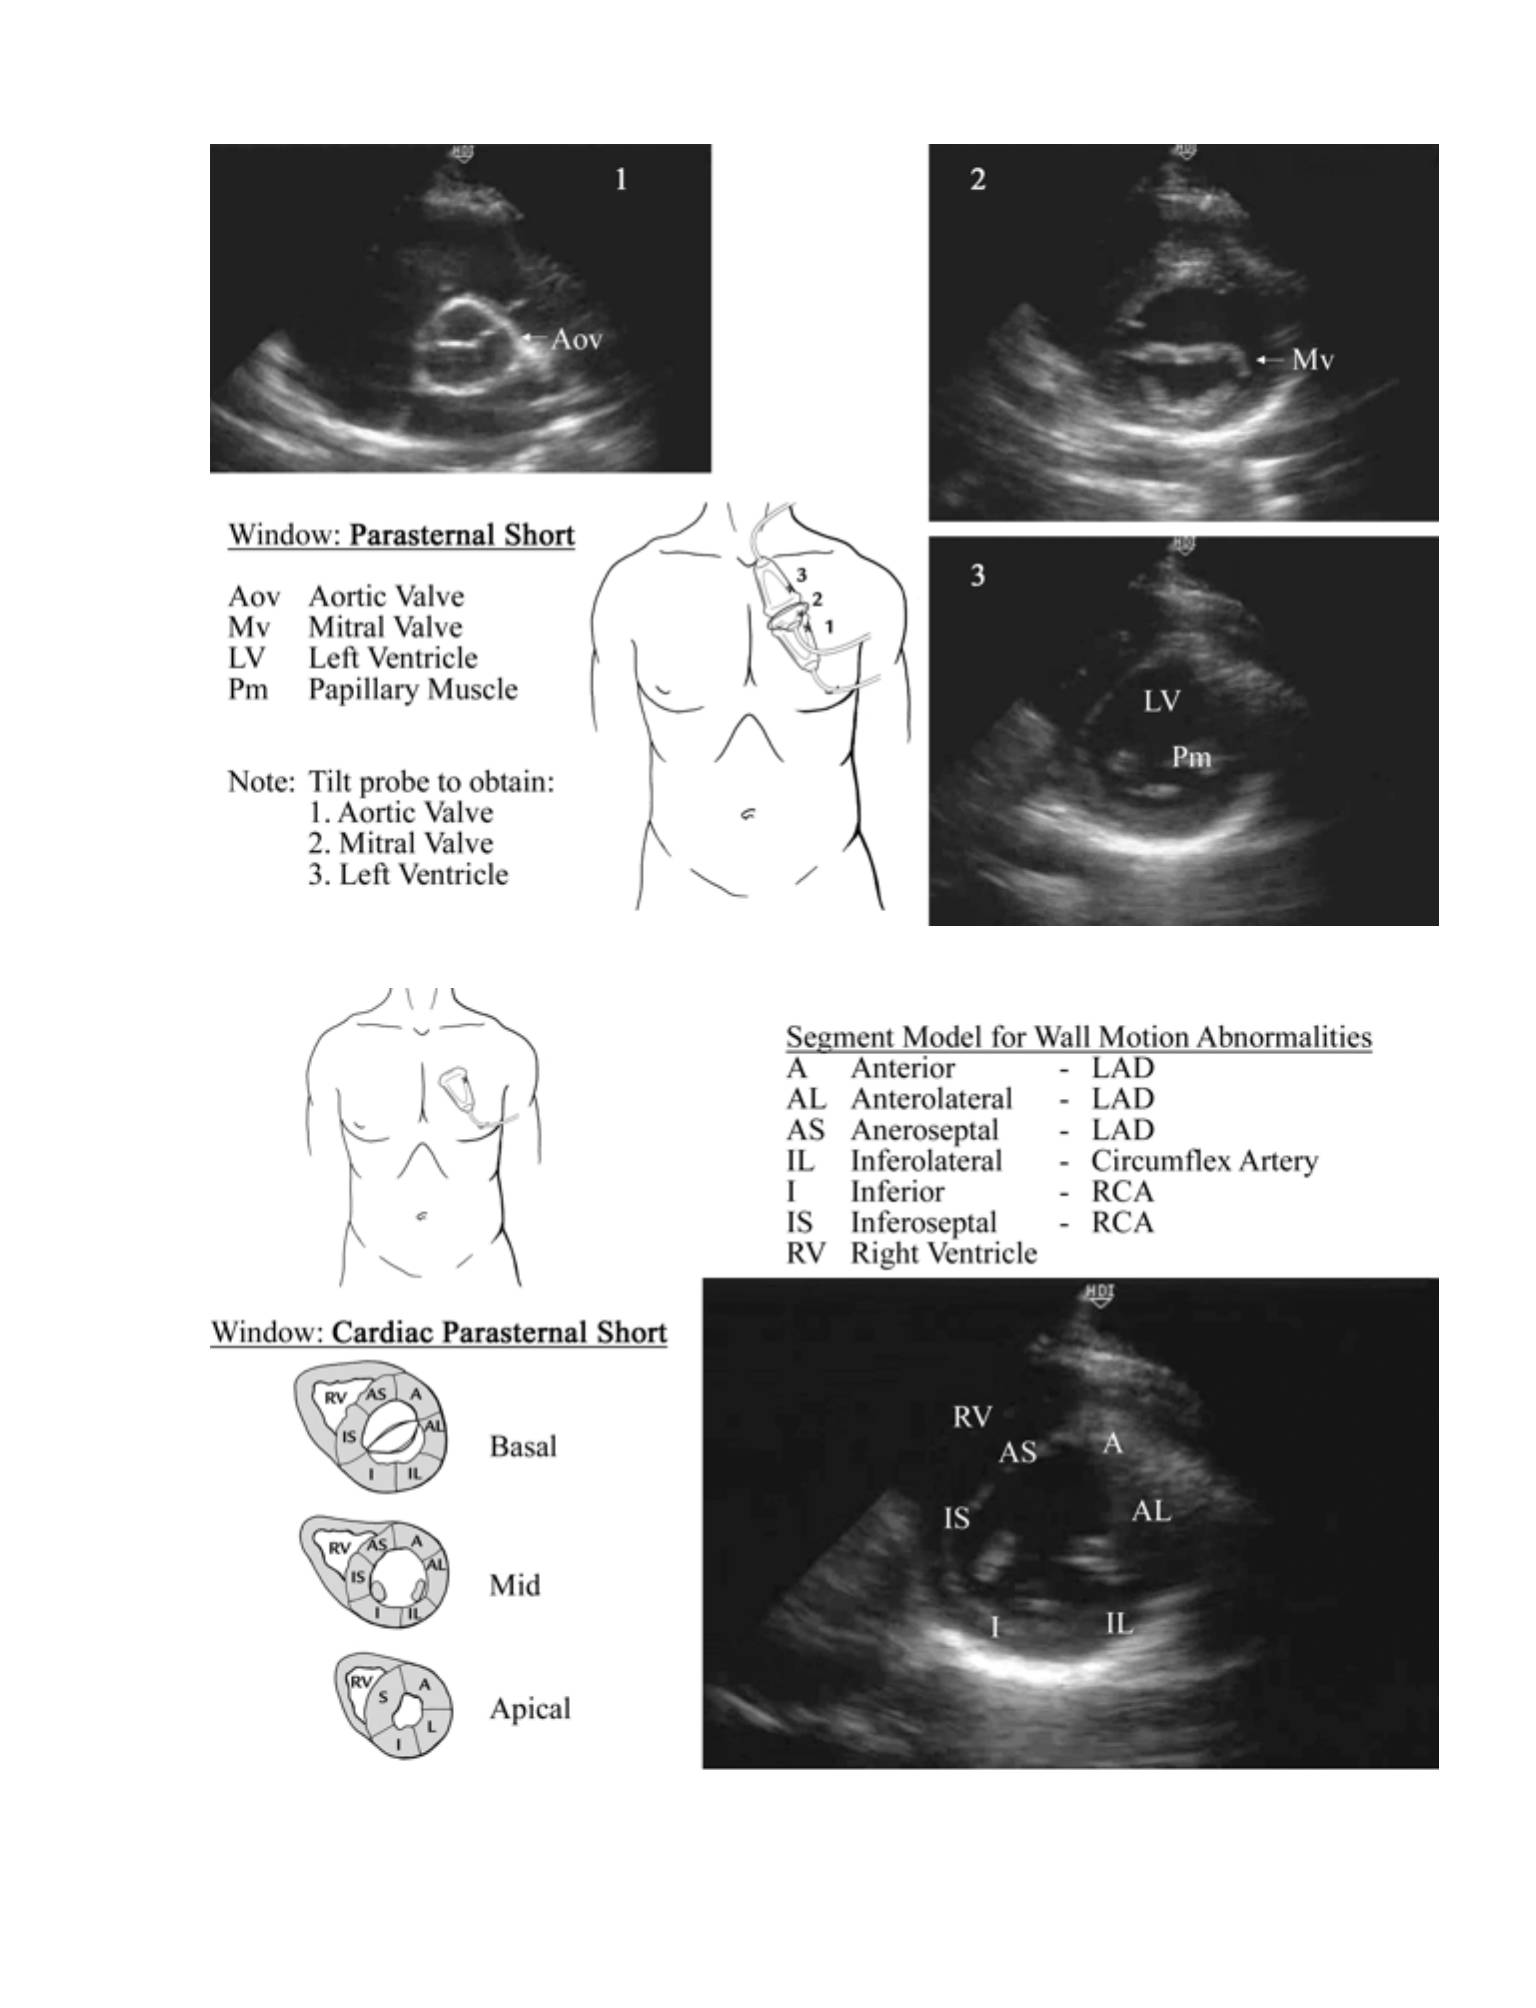
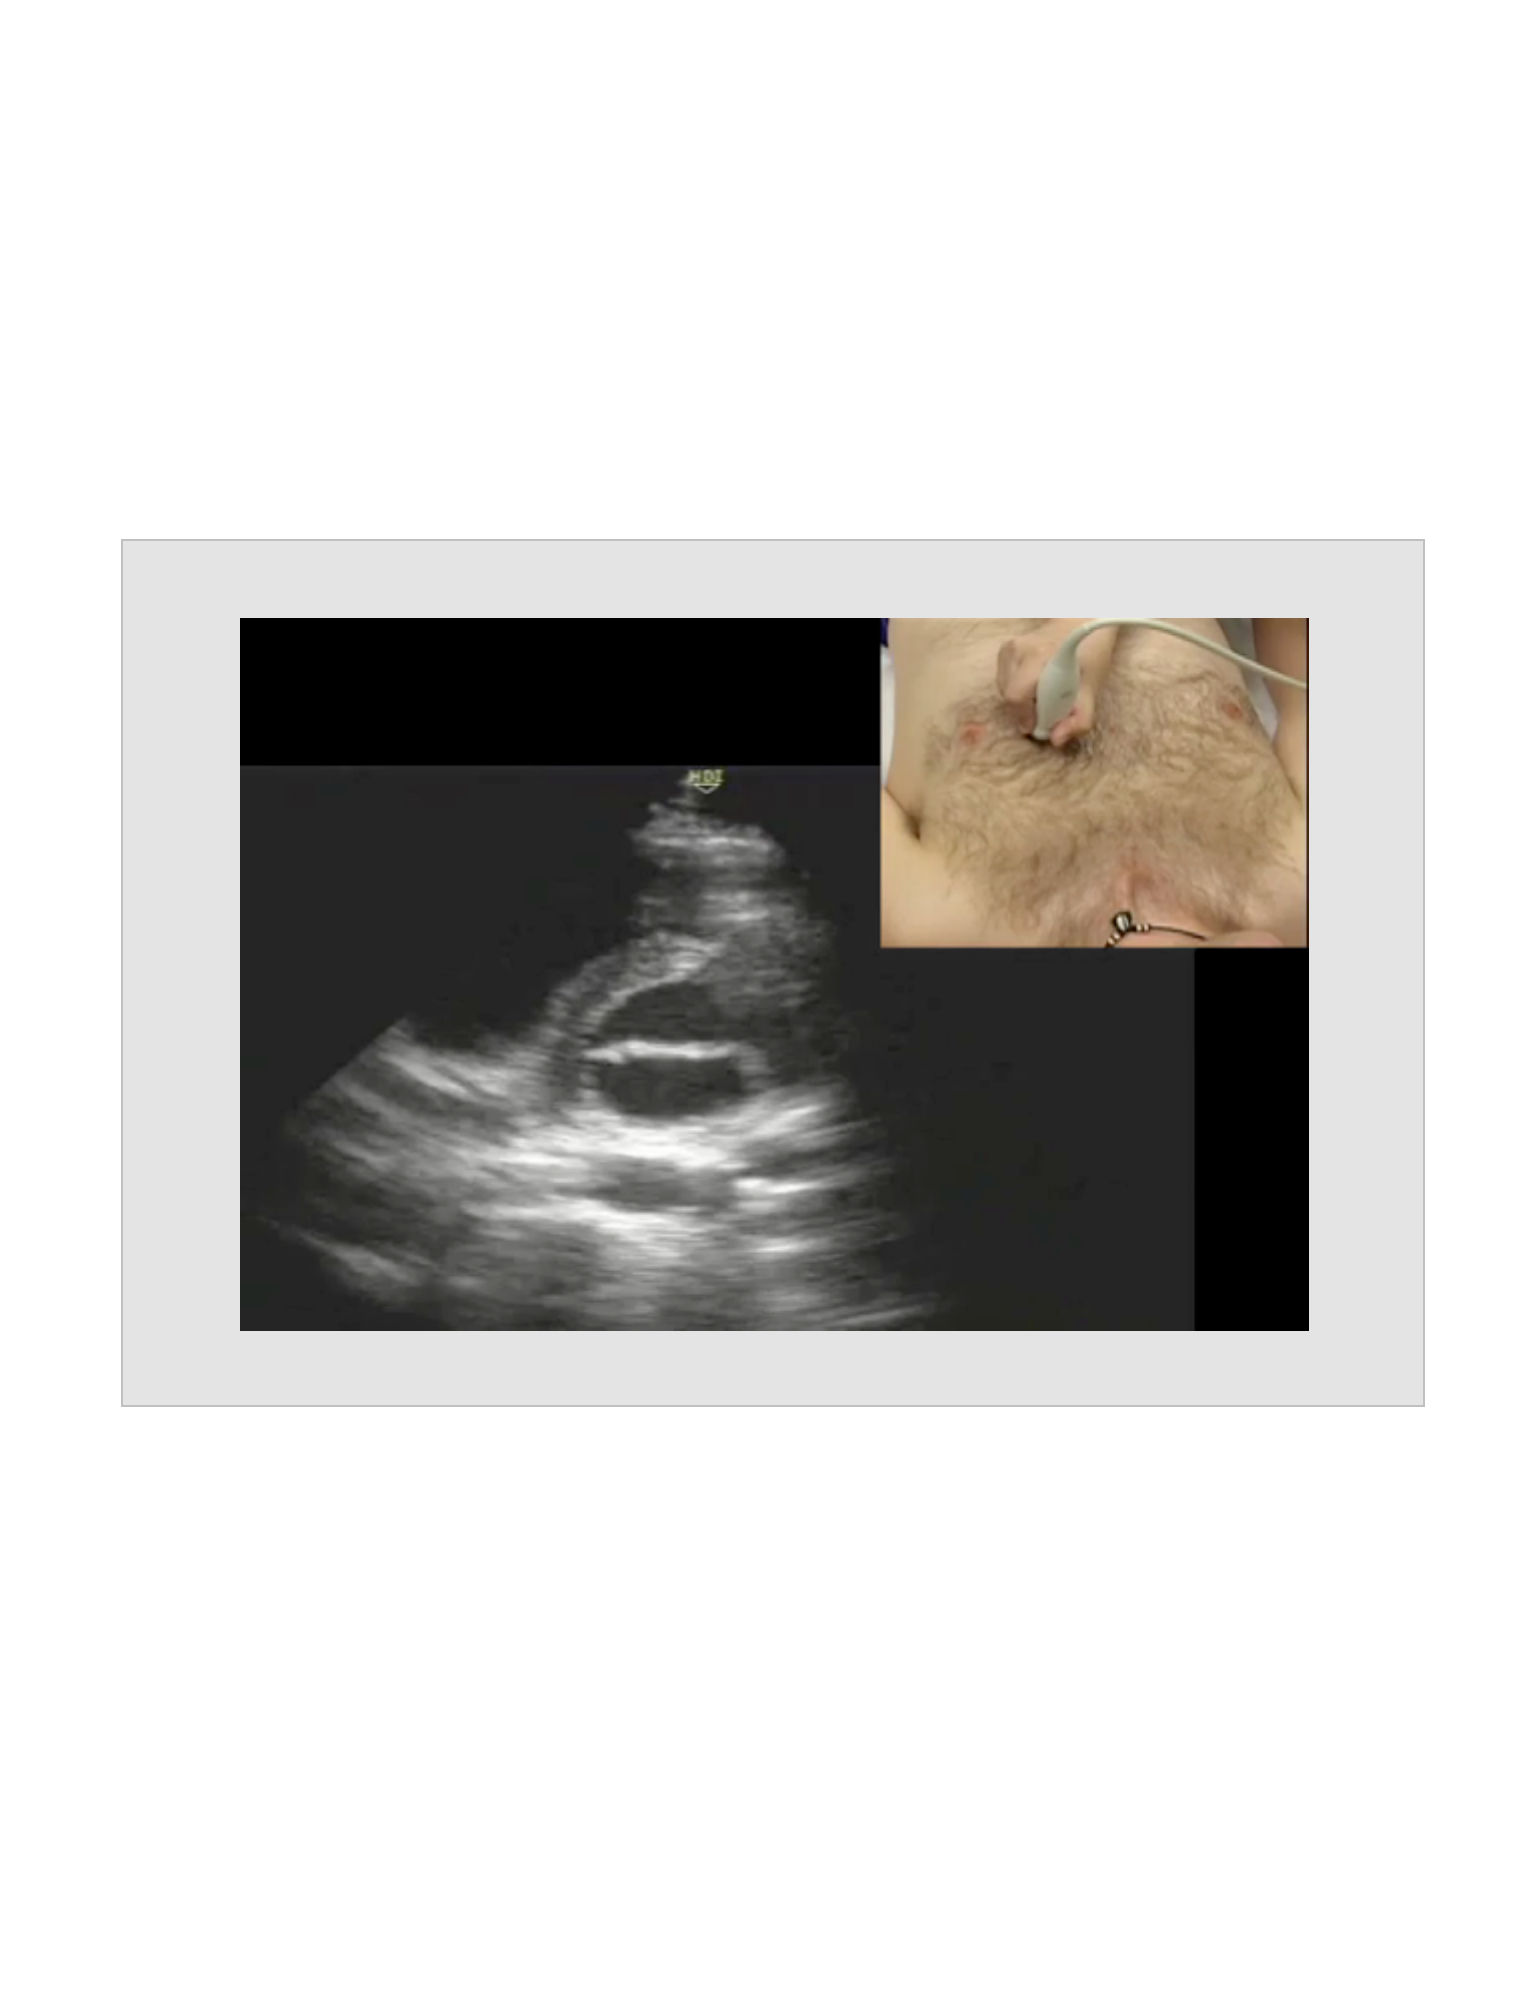
Parasternal
Probe Placement
•
Long Axis (Parasternal Long Window)
•
2nd/3rd intercostal space just to the left of the sternum with the marker
toward the right shoulder. Probe placement may be adjusted to find the
appropriate window.
•
Short Axis (Parasternal Short Window)
•
From the long axis, rotate 90 degrees clockwise so the marker points toward
the left shoulder. The probe will be angled from the right to the left to visualize
the aortic valve, then the mitral valve, then a cross sectional view of the left
ventricle.
33

Anatomic Structures
•
Long Axis
•
The heart is seen in long axis. The apex should point to the left side of the
screen with the left ventricle at the bottom of the screen. The mitral valve is
seen between the left ventricle and the left atrium located on the right side of
the screen.
•
Short Axis
•
The aortic valve appears as a tri-leaflet valve at the base of the heart and
resembles the Mercedes insignia. The mitral valve is a bicuspid valve that
resembles a "fish mouth" opening and closing. The left ventricle appears as a
muscular tube with concentric contraction.
Pathology
•
Walls that do not contract or have paradoxical motion are consistent with
ischemia or prior infarction. Thinned sections of the wall are consistent with prior
infarction.
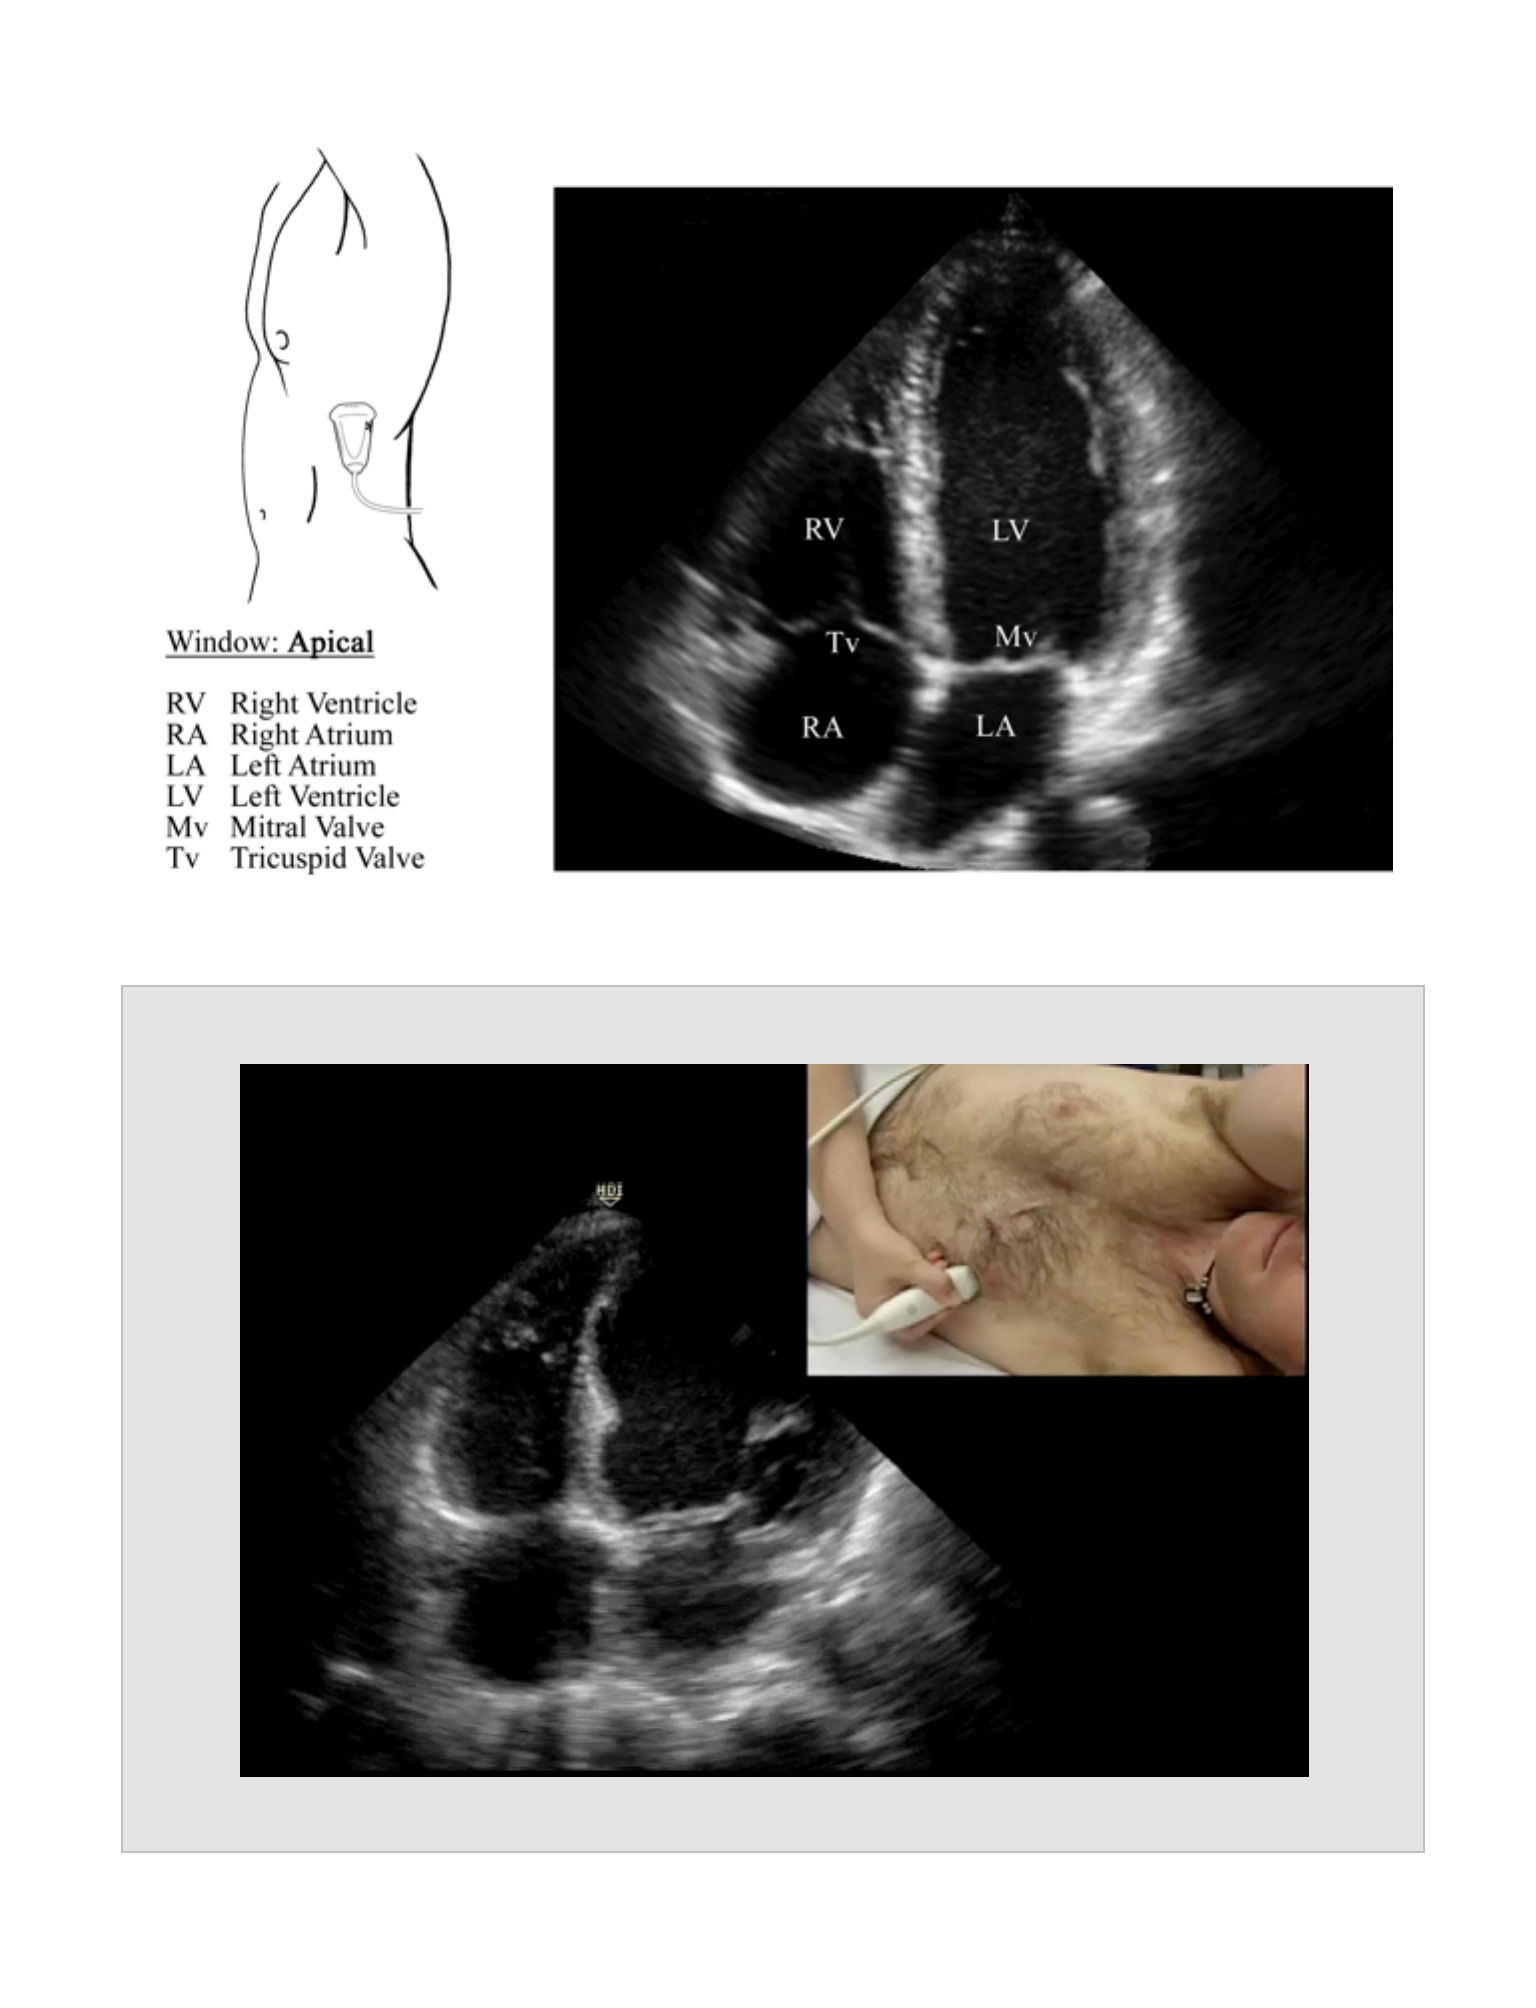
Apical
Probe Placement
•
The probe is placed on the point of maximal impulse (PMI) and directed toward
the base of the heart with the indicator pointed towards the left or back. Rotate
the probe counter-clockwise to visualize the 4-chamber, 5-chamber, and 2-
chamber view.
Anatomic Structures
•
The 4 chambers of the heart are seen with the left ventricle located at the base of
the probe. With rotation of the probe, the aorta is seen (5-chamber view) and with
further rotation, only the left ventricle and left atrium are seen (2-chamber view).
34

Pathology
•
Walls that do not contract or have paradoxical motion are consistent with
ischemia or prior infarction.
•
Thinned sections of the wall are consistent with prior infarction.
Normal Measurements
•
Aortic Root measured just beyond the coronary ostia should have a diameter of <
3.6 cm.
Pearls
•
The positions described are starting points for the cardiac exam.
•
Each position will have to be adjusted to find the best window to visualize the
cardiac structures. Not all views will be obtainable on all patients.
•
These same views can be combined with other examinations such as the FAST
exam for additional clinical information. Not all of these views must be used for all
indications.
•
In cardiac arrest situations, bedside evaluation of the heart can add valuable
information.
•
The absence of cardiac motion or the presence of IVC or ventricular thrombus is
indicative of a very poor outcome, and return of spontaneous circulation is
unlikely.
•
The presence of a pericardial effusion combined with pulseless electrical activity
(PEA) is an indication for emergent pericardiocentesis.
•
The effects of a pericardial effusion depend on the amount present as well as the
time course for the accumulation. A small effusion that accumulates quickly may
cause more hemodynamic compromise than a large effusion collecting over a
35
long period of time. The right ventricular function and the IVC must be evaluated
to determine the hemodynamic effect of a pericardial effusion.
•
IVC physiology will be reversed in the mechanically intubated patient. The IVC will
dilate with inspiration and collapse with expiration.
Pitfalls
•
A pleural effusion may be confused with a pericardial effusion in the parasternal
short view. A pericardial effusion will accumulate between the heart and the
descending aorta. A pleural effusion will not separate the aorta from the heart.
•
Endocarditis cannot be reliably diagnosed using transthoracic ultrasound.
Reports
•
Sub-xiphoid view with or without effusion
•
Cardiac activity
•
IVC collapsed or not (optional)
Clinical Integration Diagram
36
Cardiac Arrest
PEA
Yes
Cardiac Activity
No
Continue
ACLS
Consider D/C
resuscitation
Effusion
Pericardiocentesis
No effusion
37
Effusion
Hypotension or
Suspected effusion
Evaluate IVC
Complete
collapse
Pericardiocentesis
No collapse
Further
evaluation
No effusion
Evaluate IVC
Complete
collapse
No collapse
Treat
hypovolemia
Consider:
- Volume overload
- PE
- Outflow
obstruction

38
Cardiac Subcoastal Window
Movie 4.1
39
Cardiac Parasternal Long Window
Movie 4.2
40
41
Cardiac Parasternal Short Axis Window
Movie 4.3
42
Cardiac Apical Window
Movie 4.4
43
44
Pareicardial Effusion
Movie 4.5
Evaluation for Abdominal Aortic Aneurysm

EVALUATION FOR
ABDOMINAL
AORTIC ANEURYSM
CHAPTER 5
45

46
Indications
•
Concern for abdominal aortic aneurysm (AAA)
•
Abdominal pain, pulsatile abdominal mass, hypotension, back pain, flank pain and
age >50
•
Evaluation of the hypotensive patient with altered level of consciousness
Goals
•
To visualize the abdominal aorta in transverse plane (cross section) from
diaphragm to bifurcation
Probe
•
Curvilinear abdominal probe (2-5 MHz)
Patient Position
•
Supine
Standard Views and Probe Position
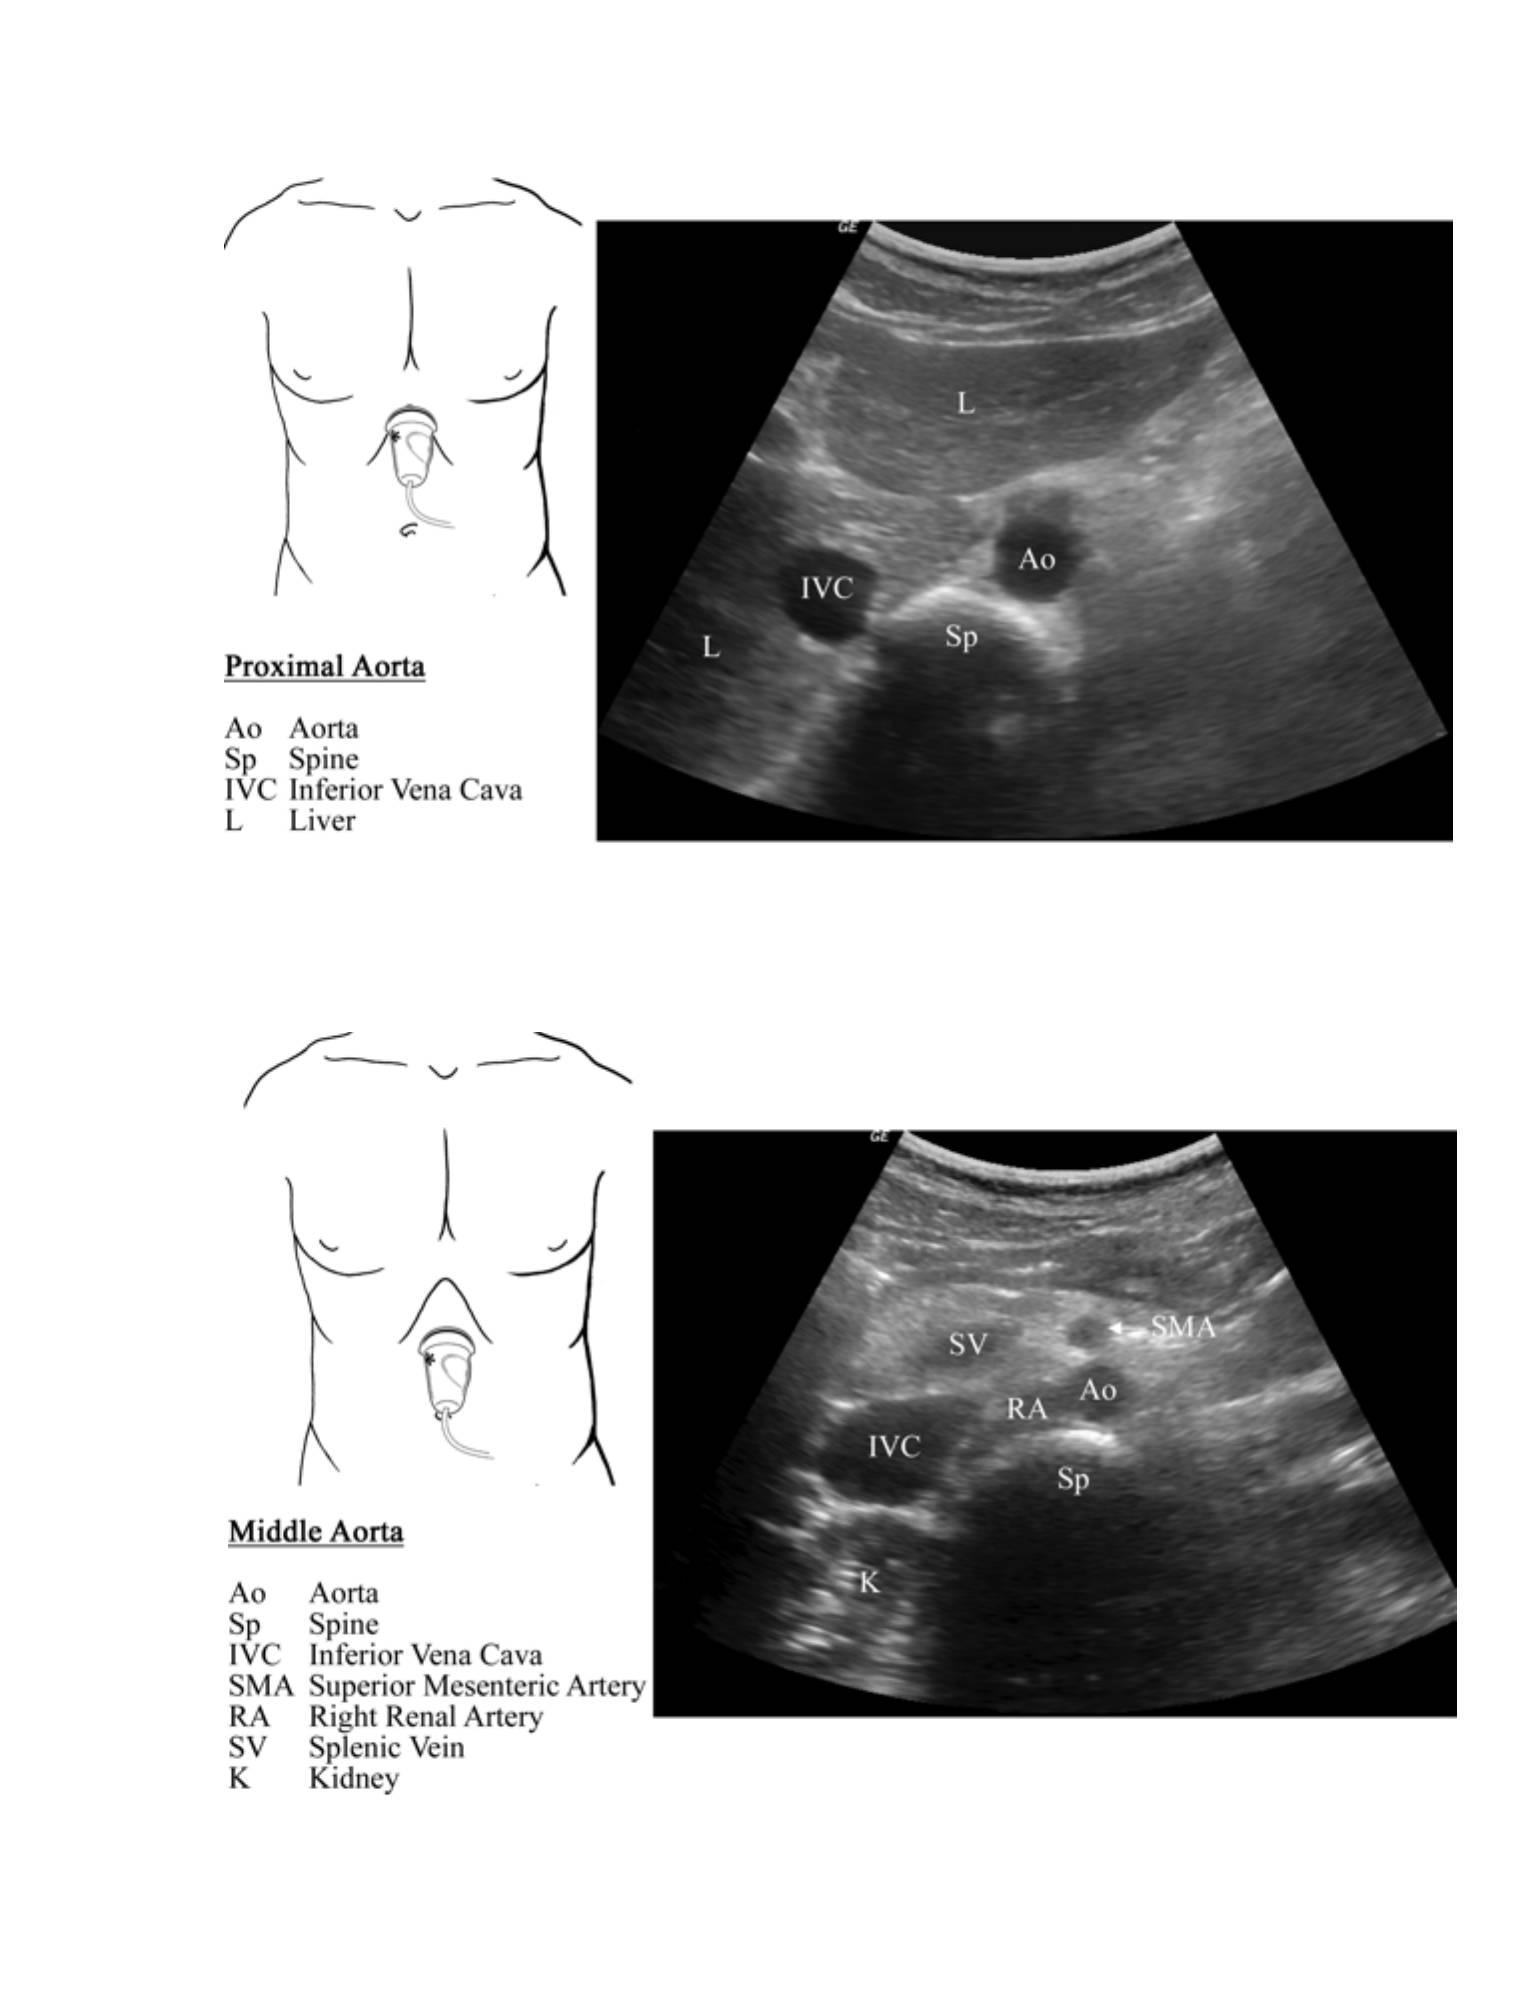
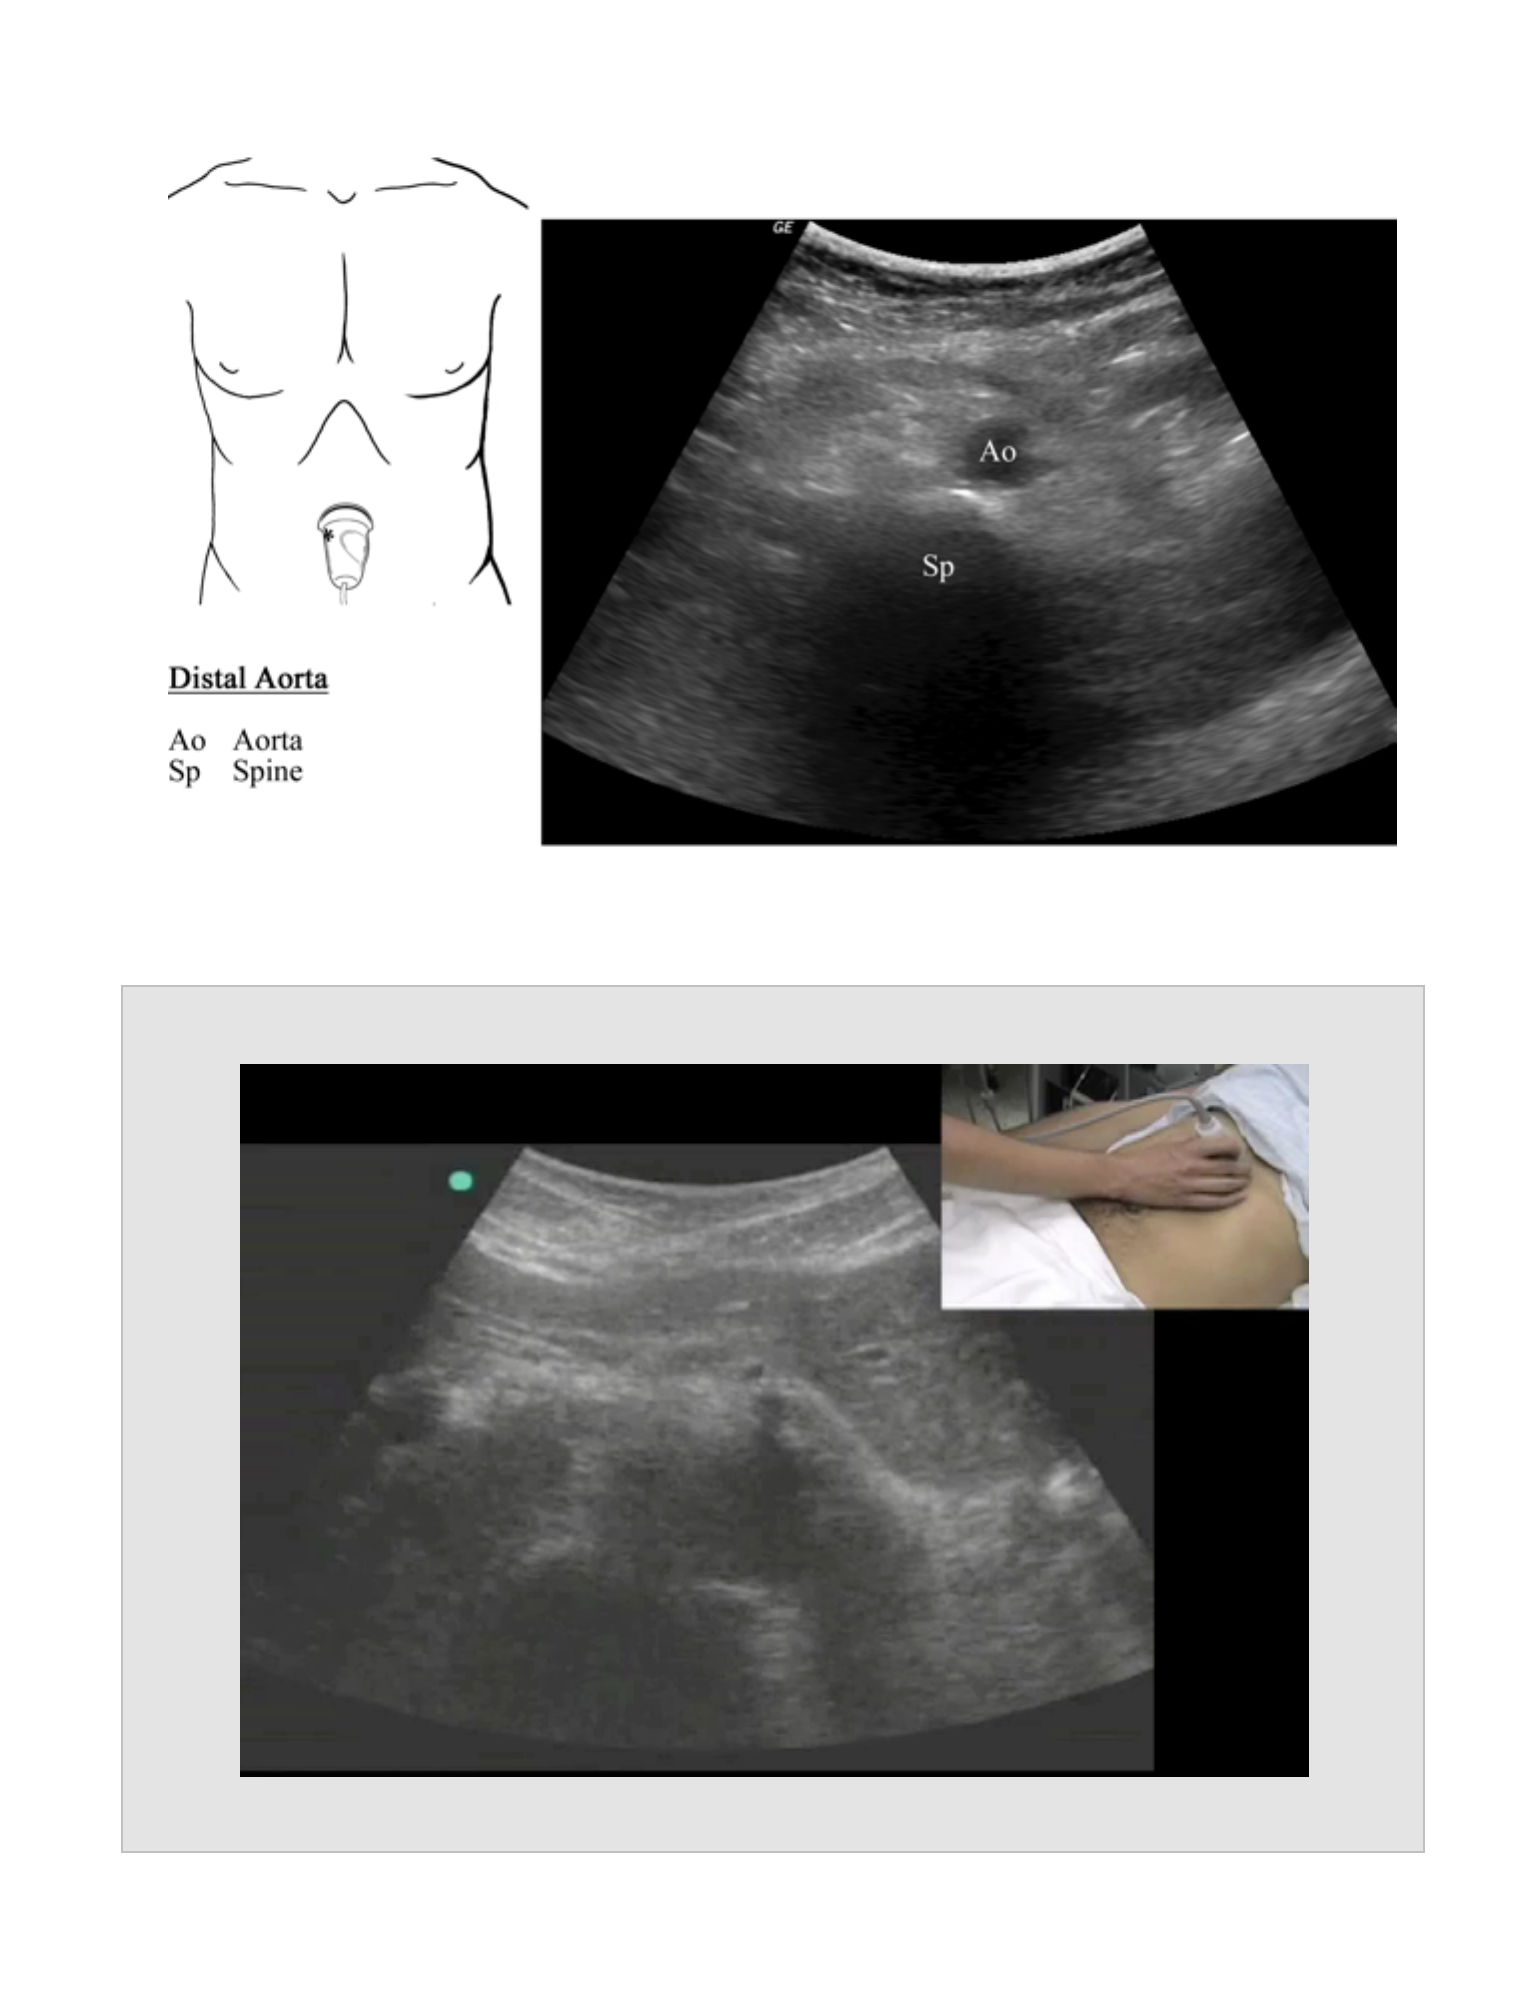
Aortic Sweep
Probe Placement
•
The probe is placed in cross section to the aorta just below the xiphoid (i.e.
directed toward the spine with the marker to the patient's right), and the entire
aorta is visualized by sliding the probe inferiorly to the aortic bifurcation.
Anatomic Structures
•
The aorta is visualized in cross section anterior to the spine (hyperechoic edge
with posterior acoustic shadowing).
Pathology
Any dilation of the aorta more than 3 cm using an anterior-posterior (A-P)
measurement is abnormal.
EVALUATION FOR
ABDOMINAL AORTIC
ANEURYSM

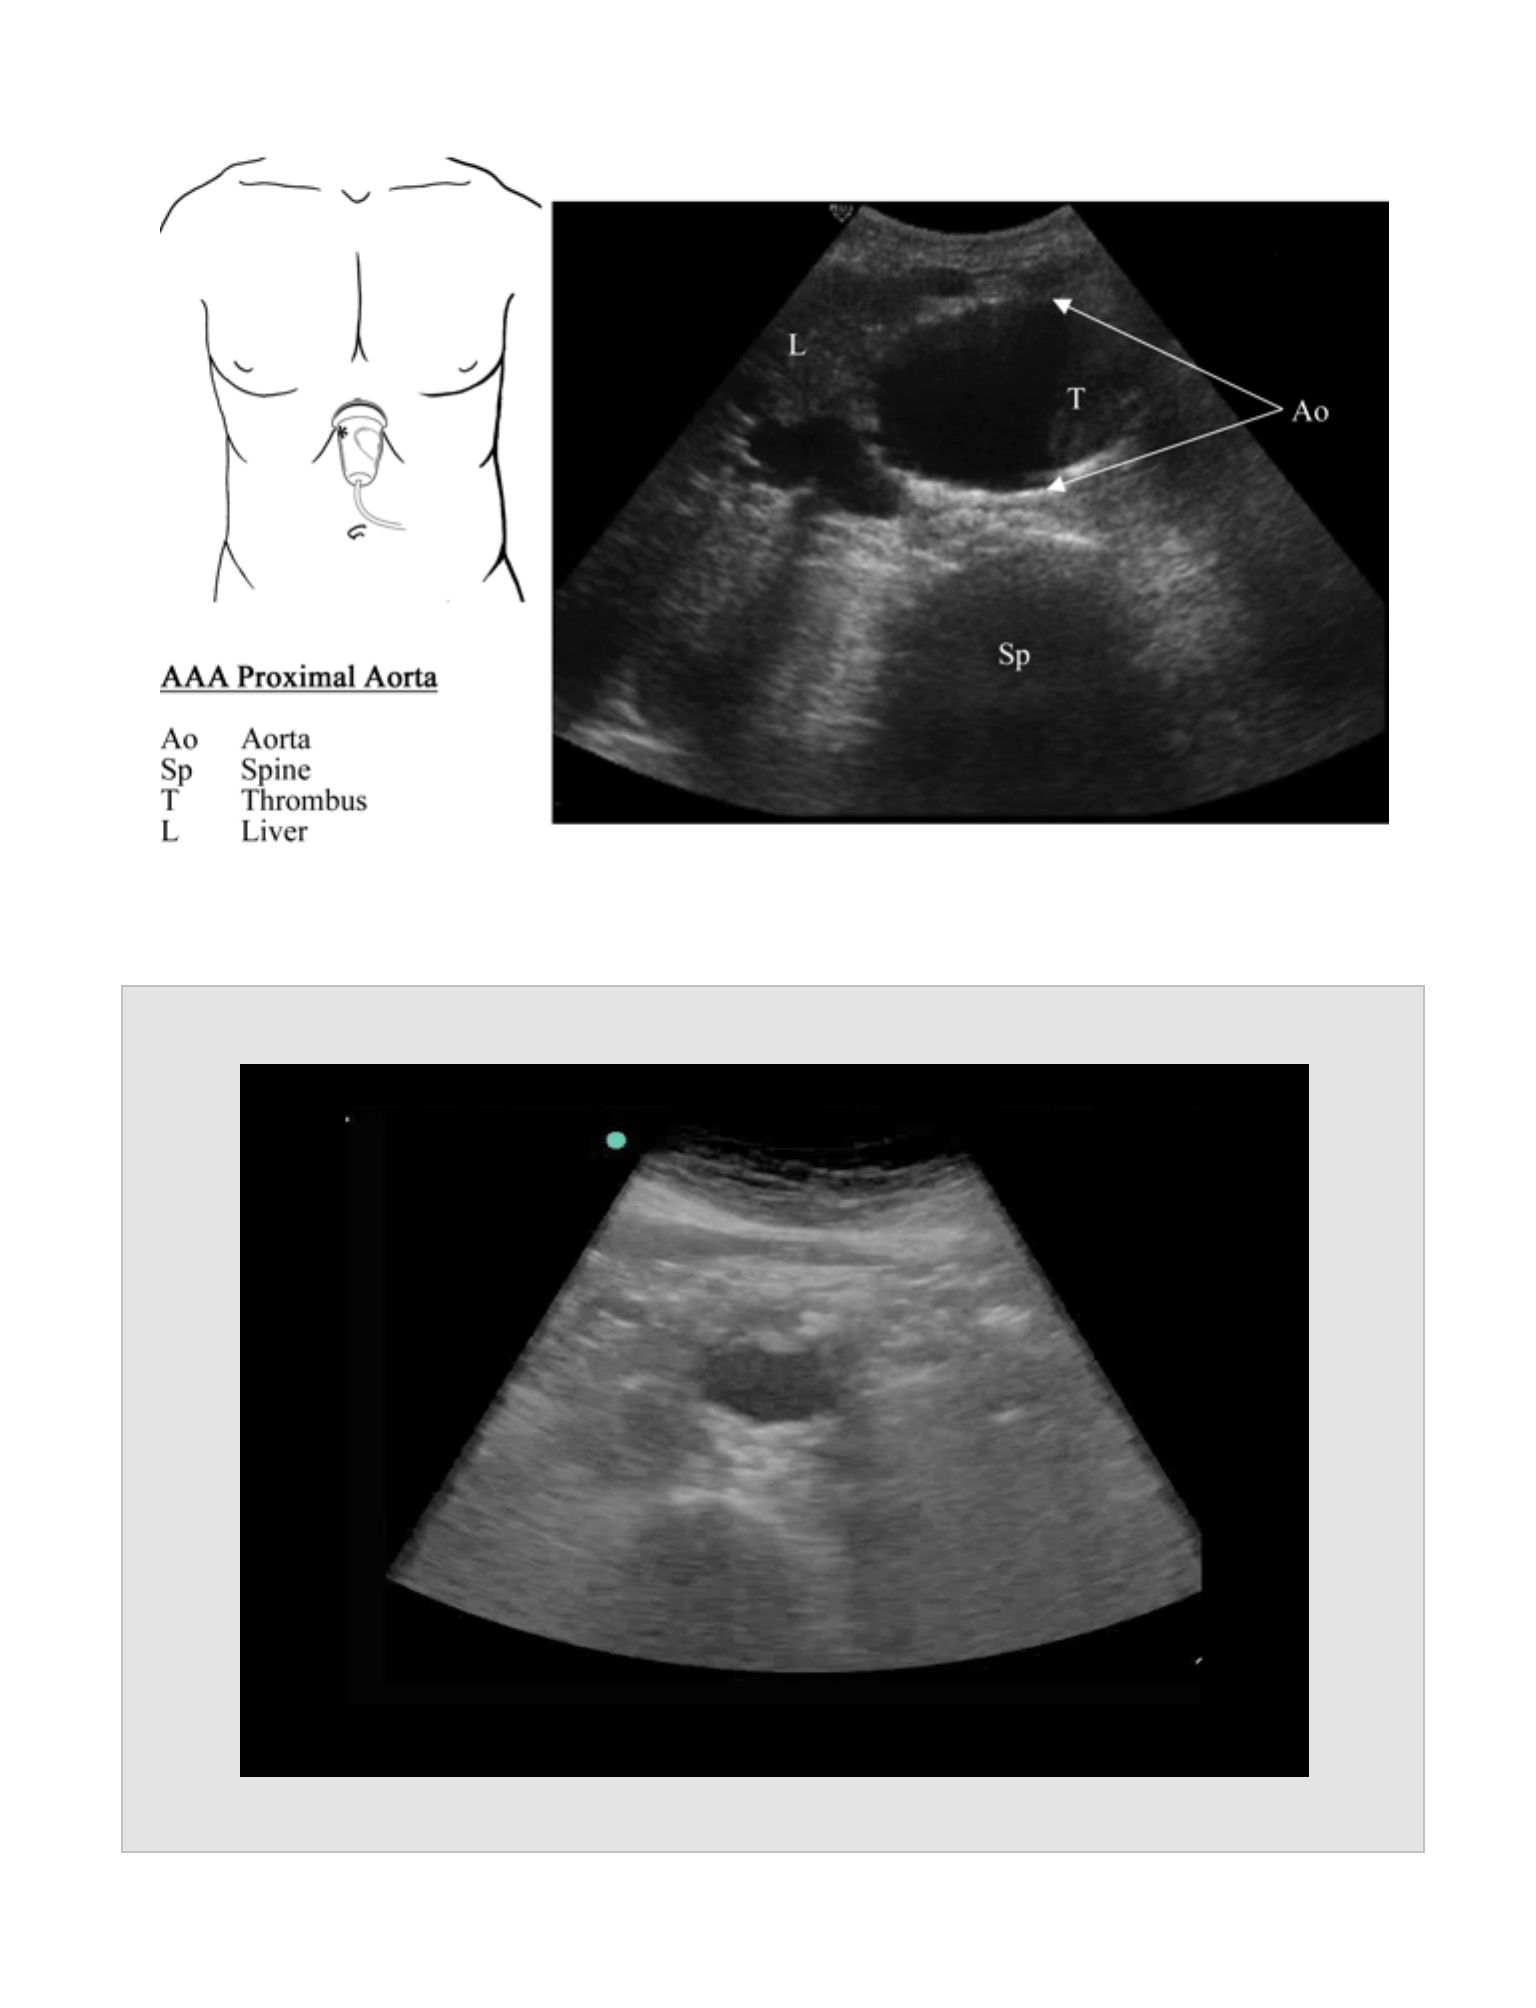
Proximal Segment
Probe Placement
•
Visualize the proximal one-third of the abdominal aorta, and measure the maximal
A-P cross sectional diameter. Measurement should occur superior to the origin of
the superior mesenteric artery (SMA) just below the xiphoid.
Anatomic Structures
•
The proximal aorta is seen just anterior to and toward the left of the spine.
Pathology
•
Proximal aortic aneurysms are rare. If a flap is seen in the lumen of the aorta, an
aortic dissection should be considered.
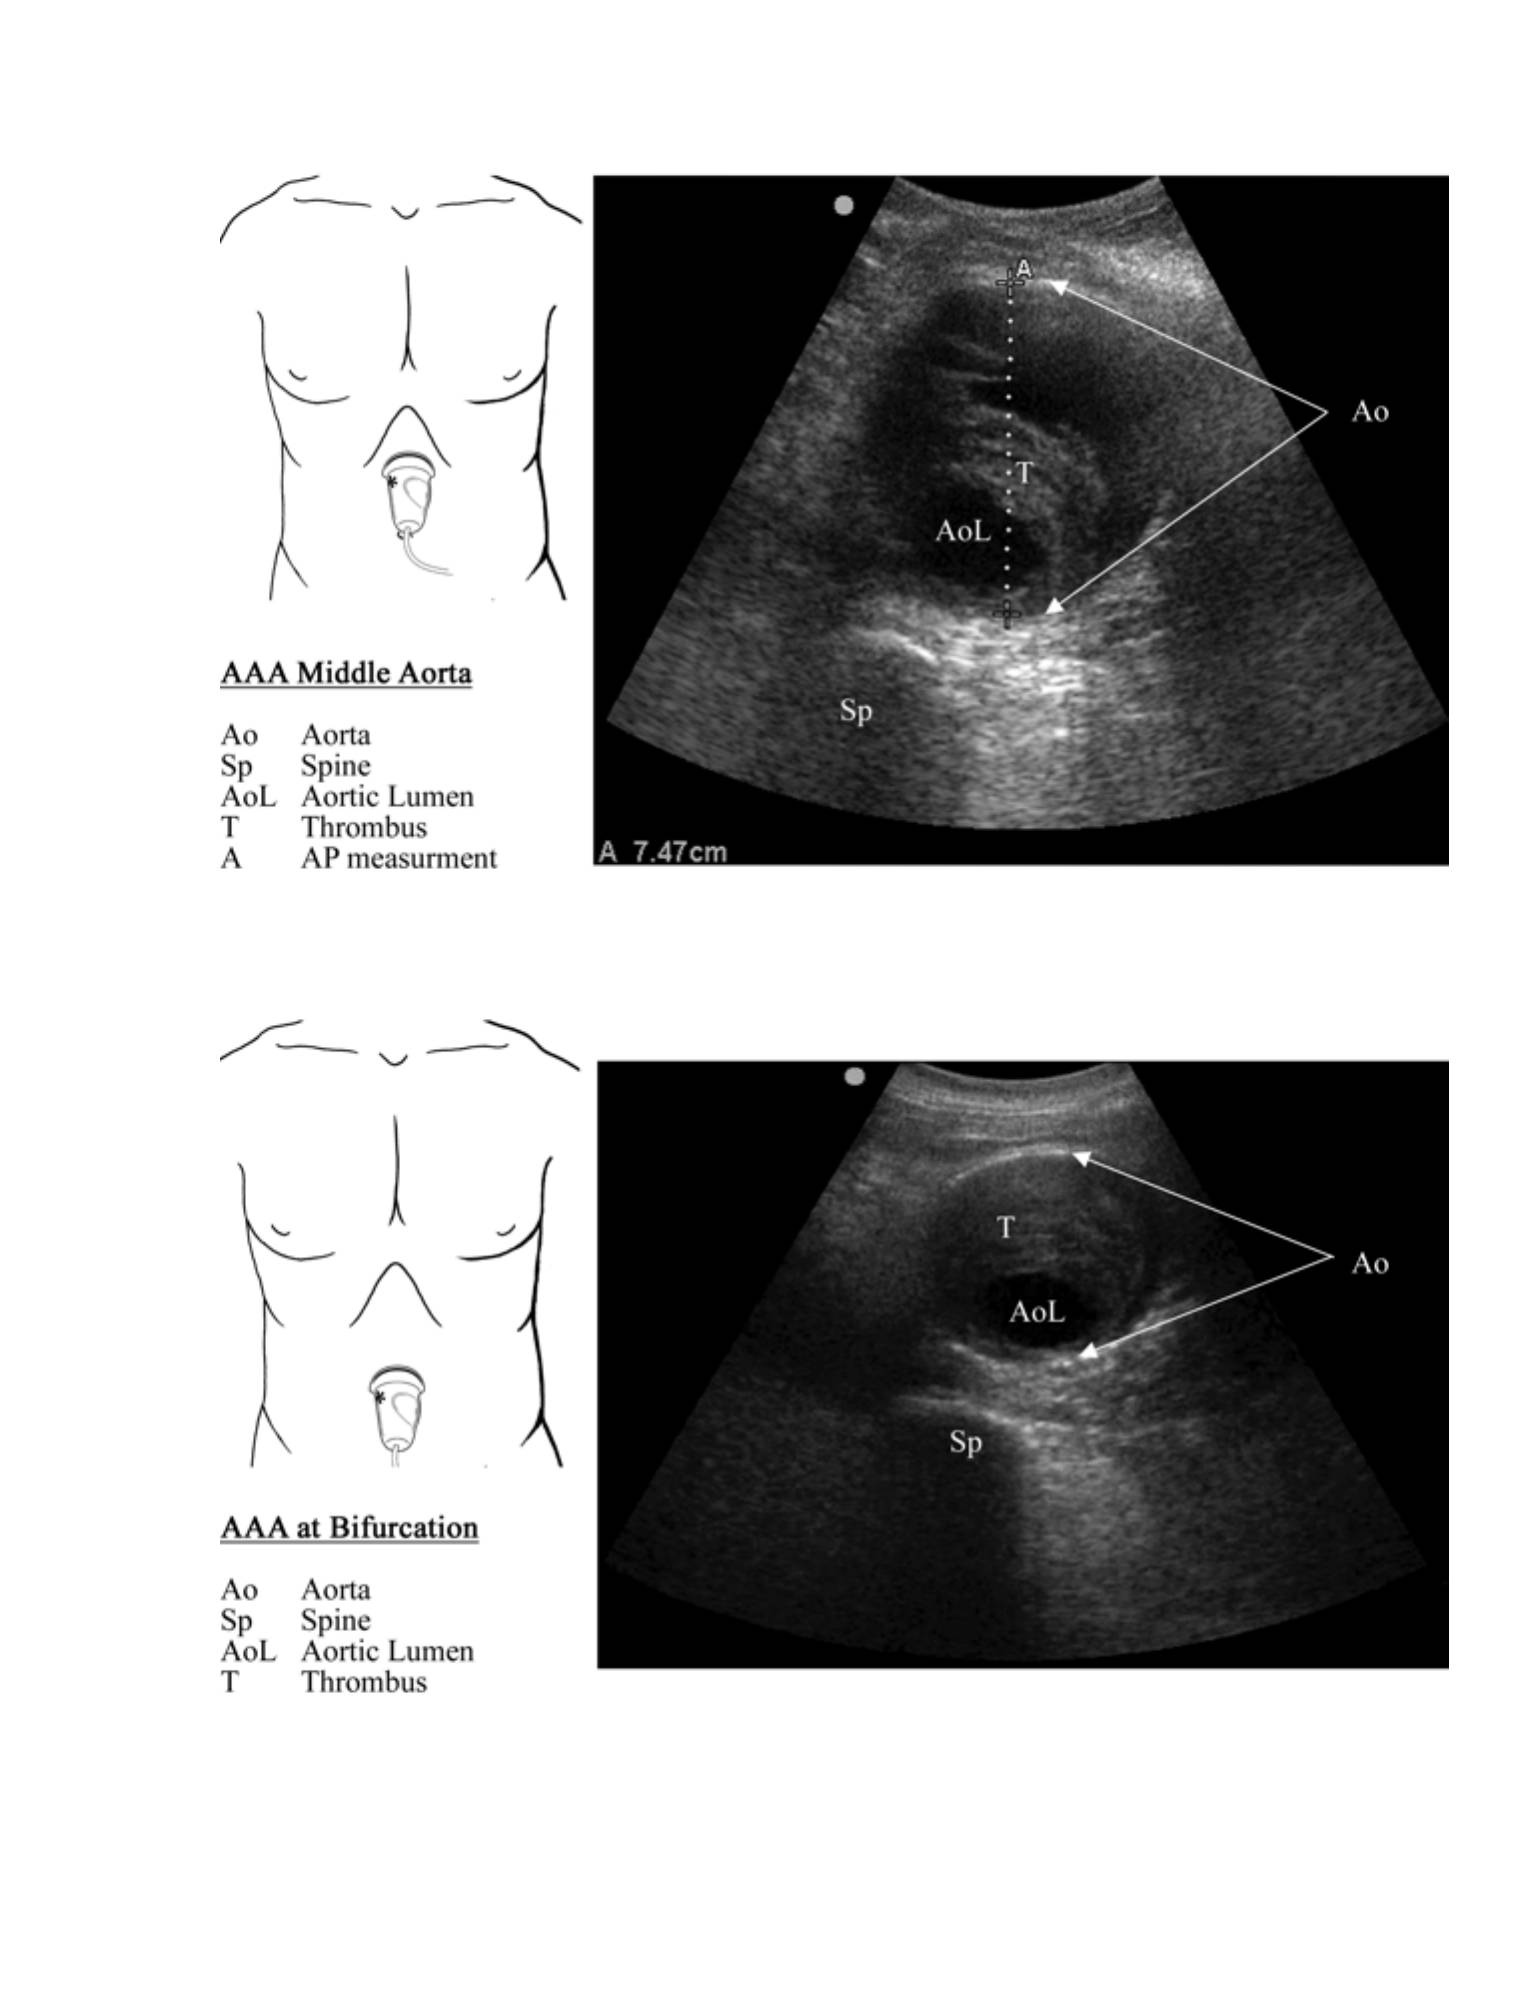
MIddle Segment
Probe Placement
•
Visualize the middle one-third of the abdominal aorta inferior to the origin of the
SMA, and measure the maximal A-P cross sectional diameter.
Anatomic Structures
•
The distal aorta is visualized just anterior to and toward the left of the spine. The
distal aorta is usually not as deep due to the lordotic curvature of the spine at this
level.
Pathology
•
The renal arteries originate in close proximity to the origin of the SMA. An
aneurysm involving this part of the aorta likely involves the renal arteries.
Distal Segment
Probe Placement
•
Visualize the distal one-third of the aorta just proximal to the bifurcation, and
measure the largest A-P cross sectional diameter.
47

Anatomic Structures
•
The distal aorta is visualized just anterior to and toward the left of the spine. The
distal aorta is usually not as deep due to the lordotic curvature of the spine at this
level.
Pathology
•
Greater than 90% of AAAs are infrarenal and involve the distal aorta.
Normal Measurements
•
The aorta normally tapers from proximal to distal with a maximal normal diameter
of 3 cm as measured using an A-P cross sectional measurement from outside wall
to outside wall.
Pearls
•
Bowel gas often obscures parts of the aorta. Persistent probe pressure can help
displace air in the obscuring bowel and make visualization of the aorta possible.
•
Color and spectral Doppler can be used as adjuncts to confirm the identity of the
aorta; however, the limitations of Doppler ultrasound should be understood before
relying on this method.
Pitfalls
•
Ultrasound is used to diagnose the presence of abdominal aortic aneurysm.
Because the aorta is retroperitoneal, ultrasound is not sensitive in the diagnosis of
rupture. Most survivors have ruptures that are contained in the retroperitoneum,
and intraperitoneal ruptures rarely survive to the hospital.
•
The spine can easily be confused with the aorta, particularly an aneurysmal aorta.
Clearly identify the aorta and the spine to avoid confusion.
•
Abdominal aortic aneurysms often contain clot. Failure to recognize mural
thrombus as part of the aortic lumen may lead to erroneously small
measurements.
48
•
Long axis measurements of the aortic diameter are inaccurate.
•
Measurements should only be taken in cross section where the maximum
diameter can be evaluated.
Reports
•
Proximal segment with AP measurement
•
Middle segment with AP measurement
•
Distal segment with AP measurement
Clinical Integration Diagram
49
Abdominal Aorta
Further assessment
of AAA
> 3 cm
No AAA
< 3 cm
50
51
Abdominal Aorta Evaluation
Movie 5.1
52
Abdominal Aorta Aneurysm
Movie 5.2
53
Biliary (RUQ) Exam
BILIARY (RUQ) EXAM
CHAPTER 6
54

55
Indications
•
Right upper quadrant or epigastric abdominal pain
•
Suspicion for biliary colic, cholecystitis, cholangitis
Goals
•
To evaluate for the presence of stones or sludge in the gallbladder
•
To evaluate for the presence of cholecystitis
Probe
•
Curvilinear abdominal probe (2-5 MHz)
•
Sector probe
•
The smaller footprint may be of use in certain situations such as excessive rib
shadowing.Patient Position
Patient Position
•
The supine position is often sufficient.
•
The left lateral decubitus position will assist in bringing the gallbladder out
from beneath the ribs and closer to the skin.
•
If there is a question of sludge or an impacted stone, this can often be
delineated by rolling the patient between the supine and left lateral
decubitus positions.
Standard Views and Probe Position
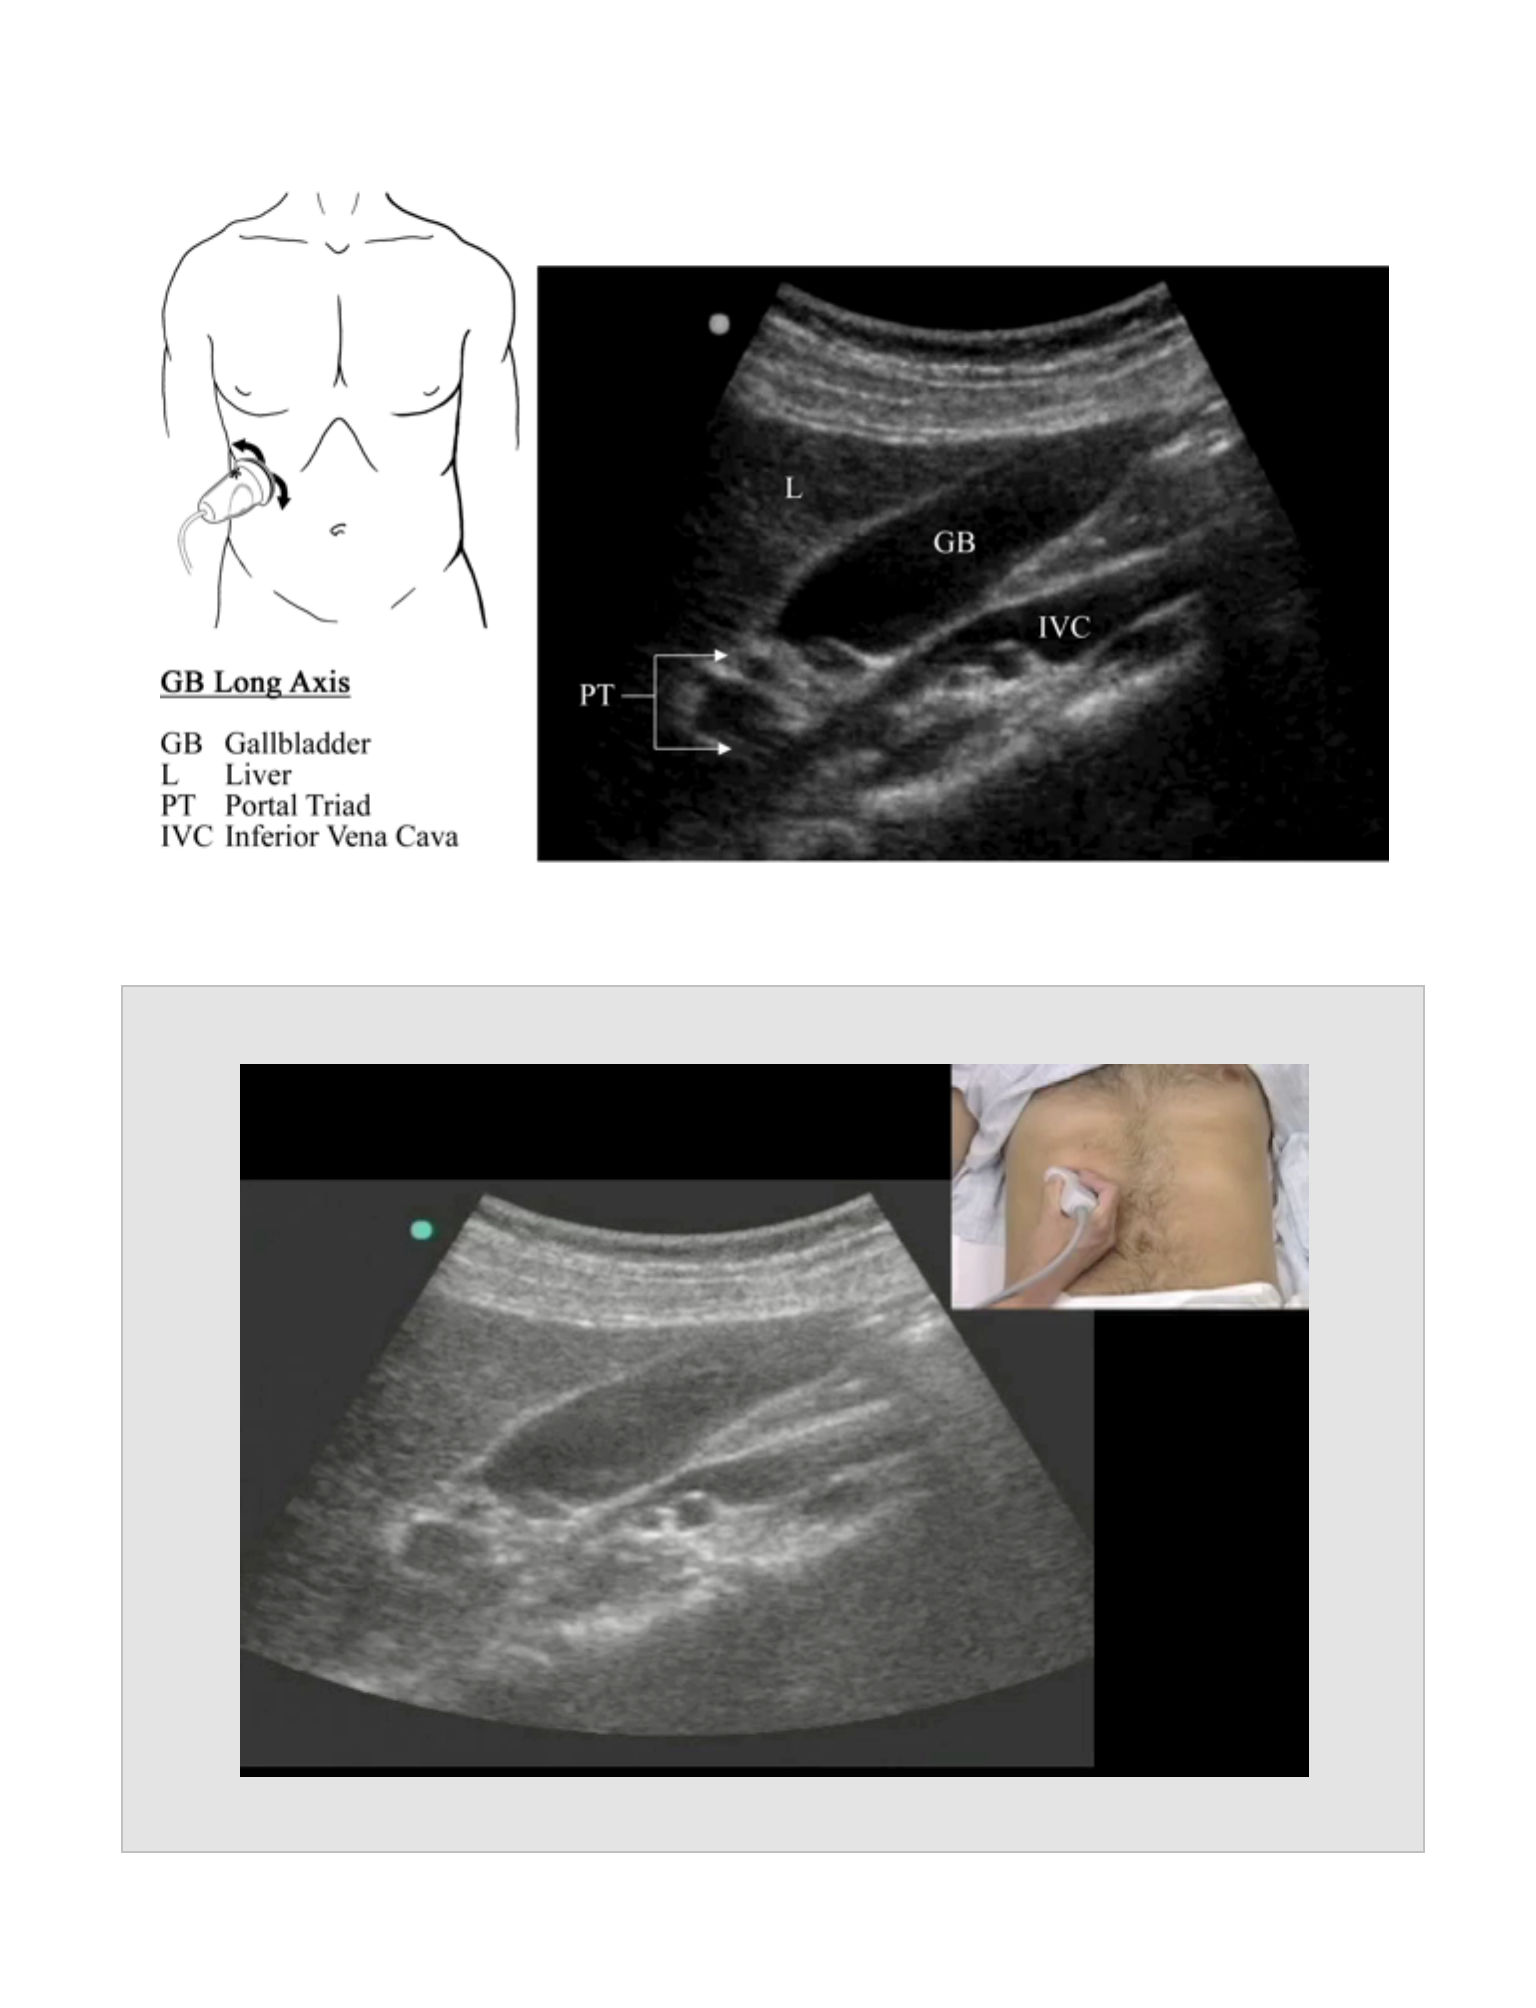
Gallbladder
Probe Placement
•
Place the probe longitudinally below the xiphoid with the pointer cephalad, and
follow the rib margin laterally to the right.
•
The gallbladder position is variable, but it is generally located between the nipple
line and the anterior axillary line.
•
The gallbladder is found at the inferior edge of the liver, medial and anterior to the
kidney, and lateral to the IVC.
•
Orient the probe with respect to the gallbladder, not to the body. The long and
short axes refer to the gallbladder axis.
BILIARY (RUQ) EXAM

•
Obtain complete views of the gallbladder in both long and short axes. This is
done by panning from side to side in long axis, and from the gallbladder fundus to
the neck in the short axis.
Anatomic Structures
•
Visualize the liver and the hypoechoic gallbladder.
•
The gallbladder wall appears hyperechoic and may appear as a double wall if the
gallbladder is contracted.
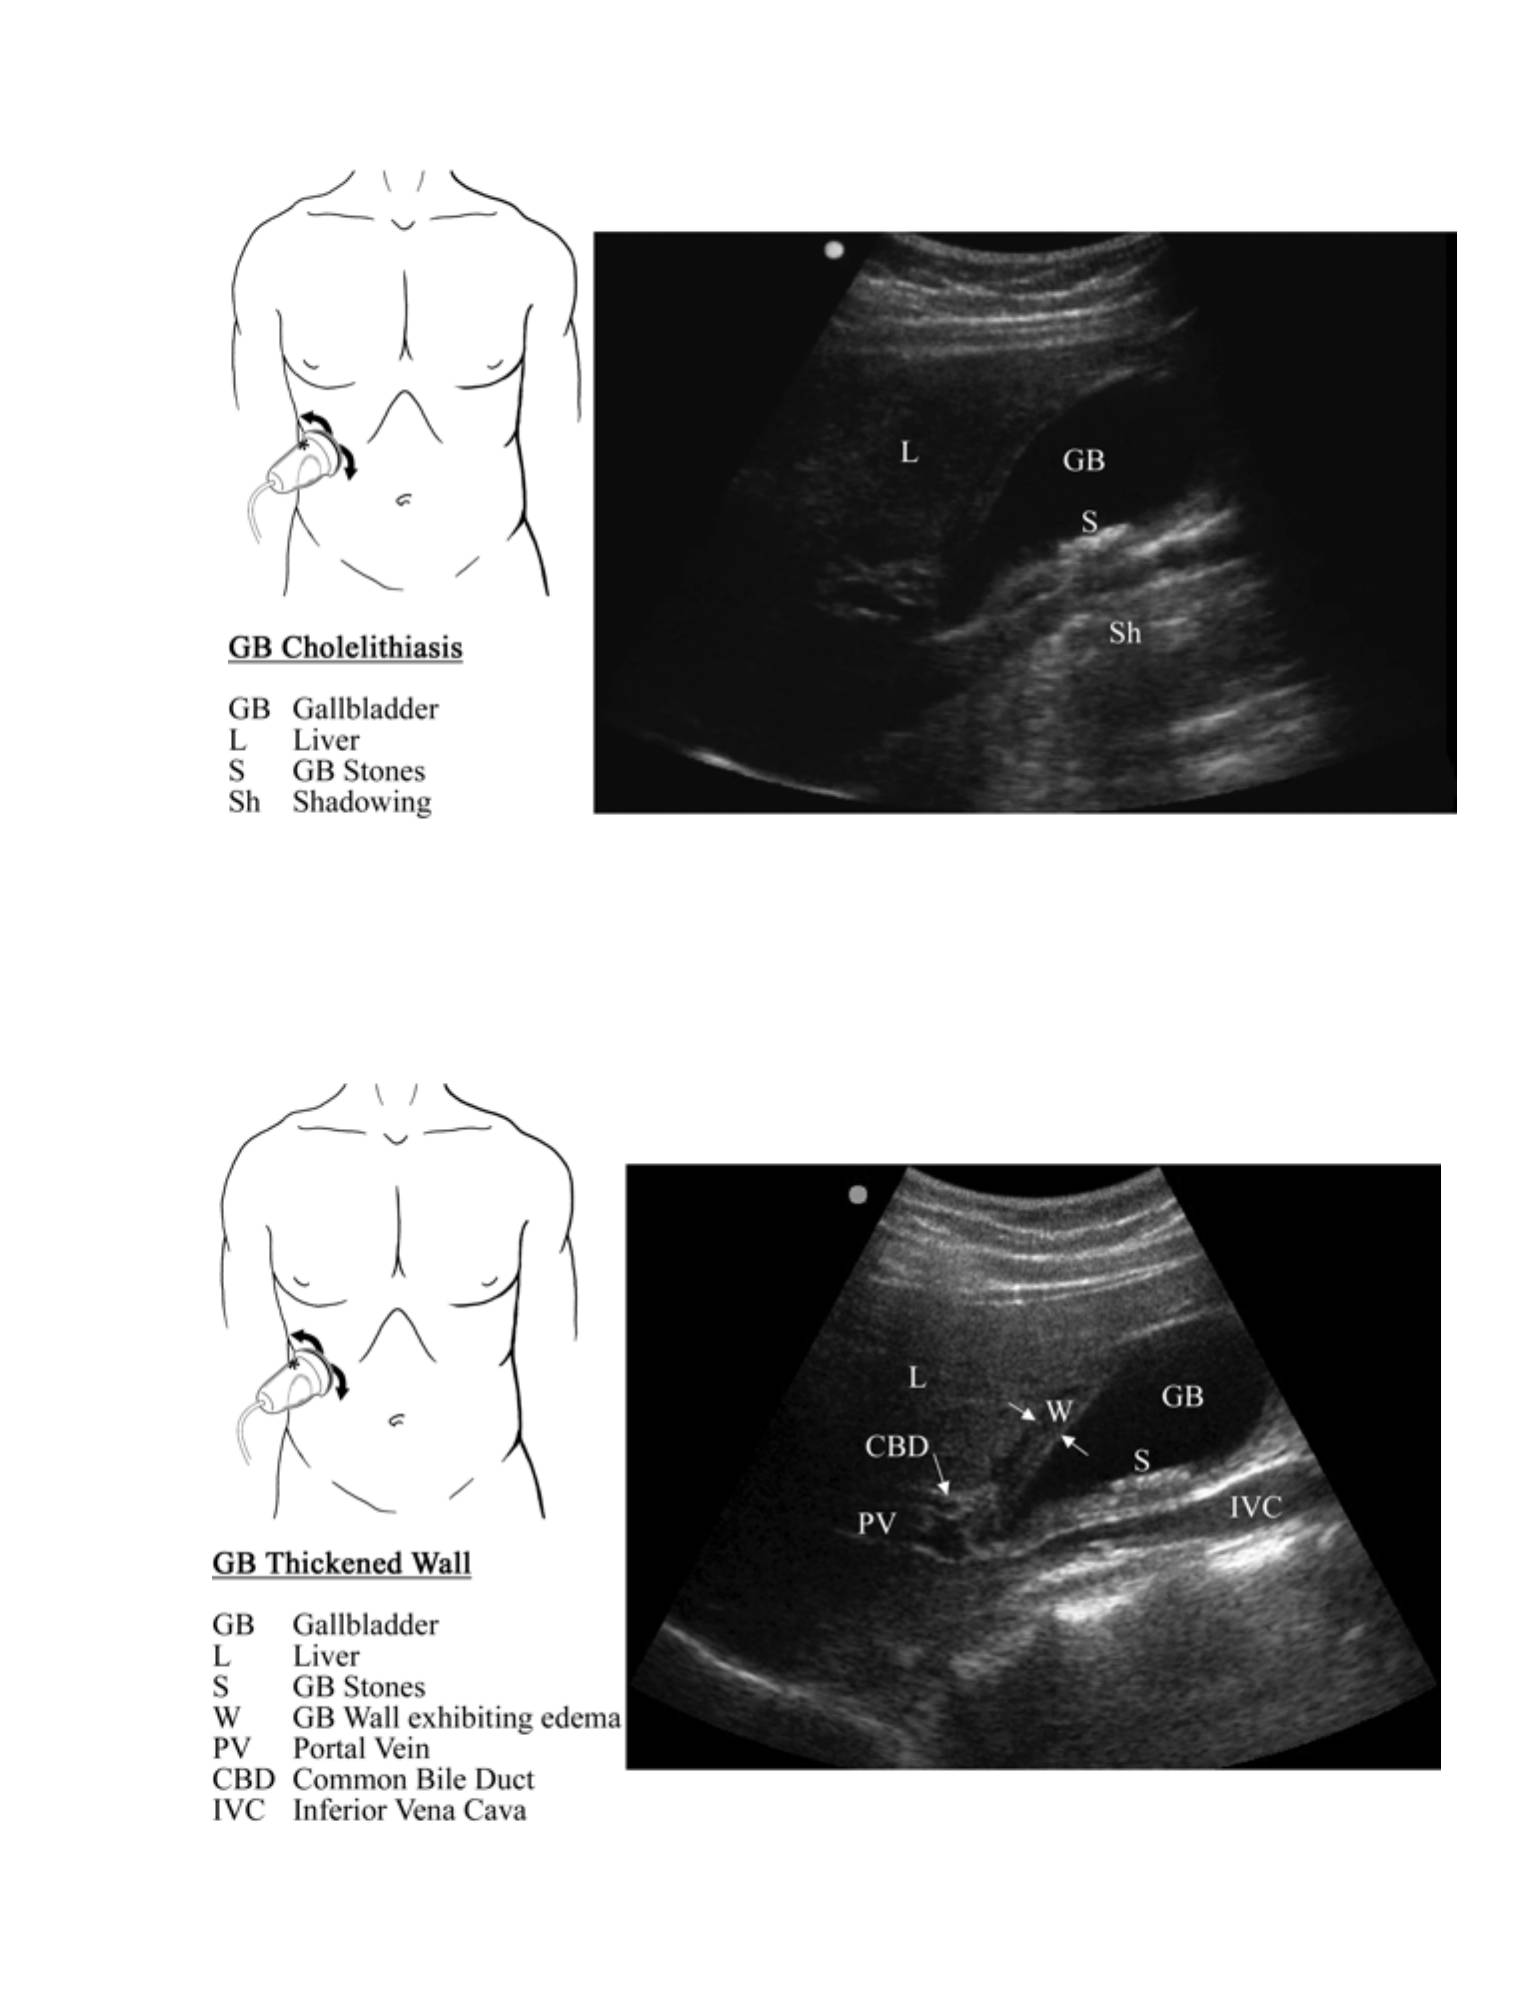
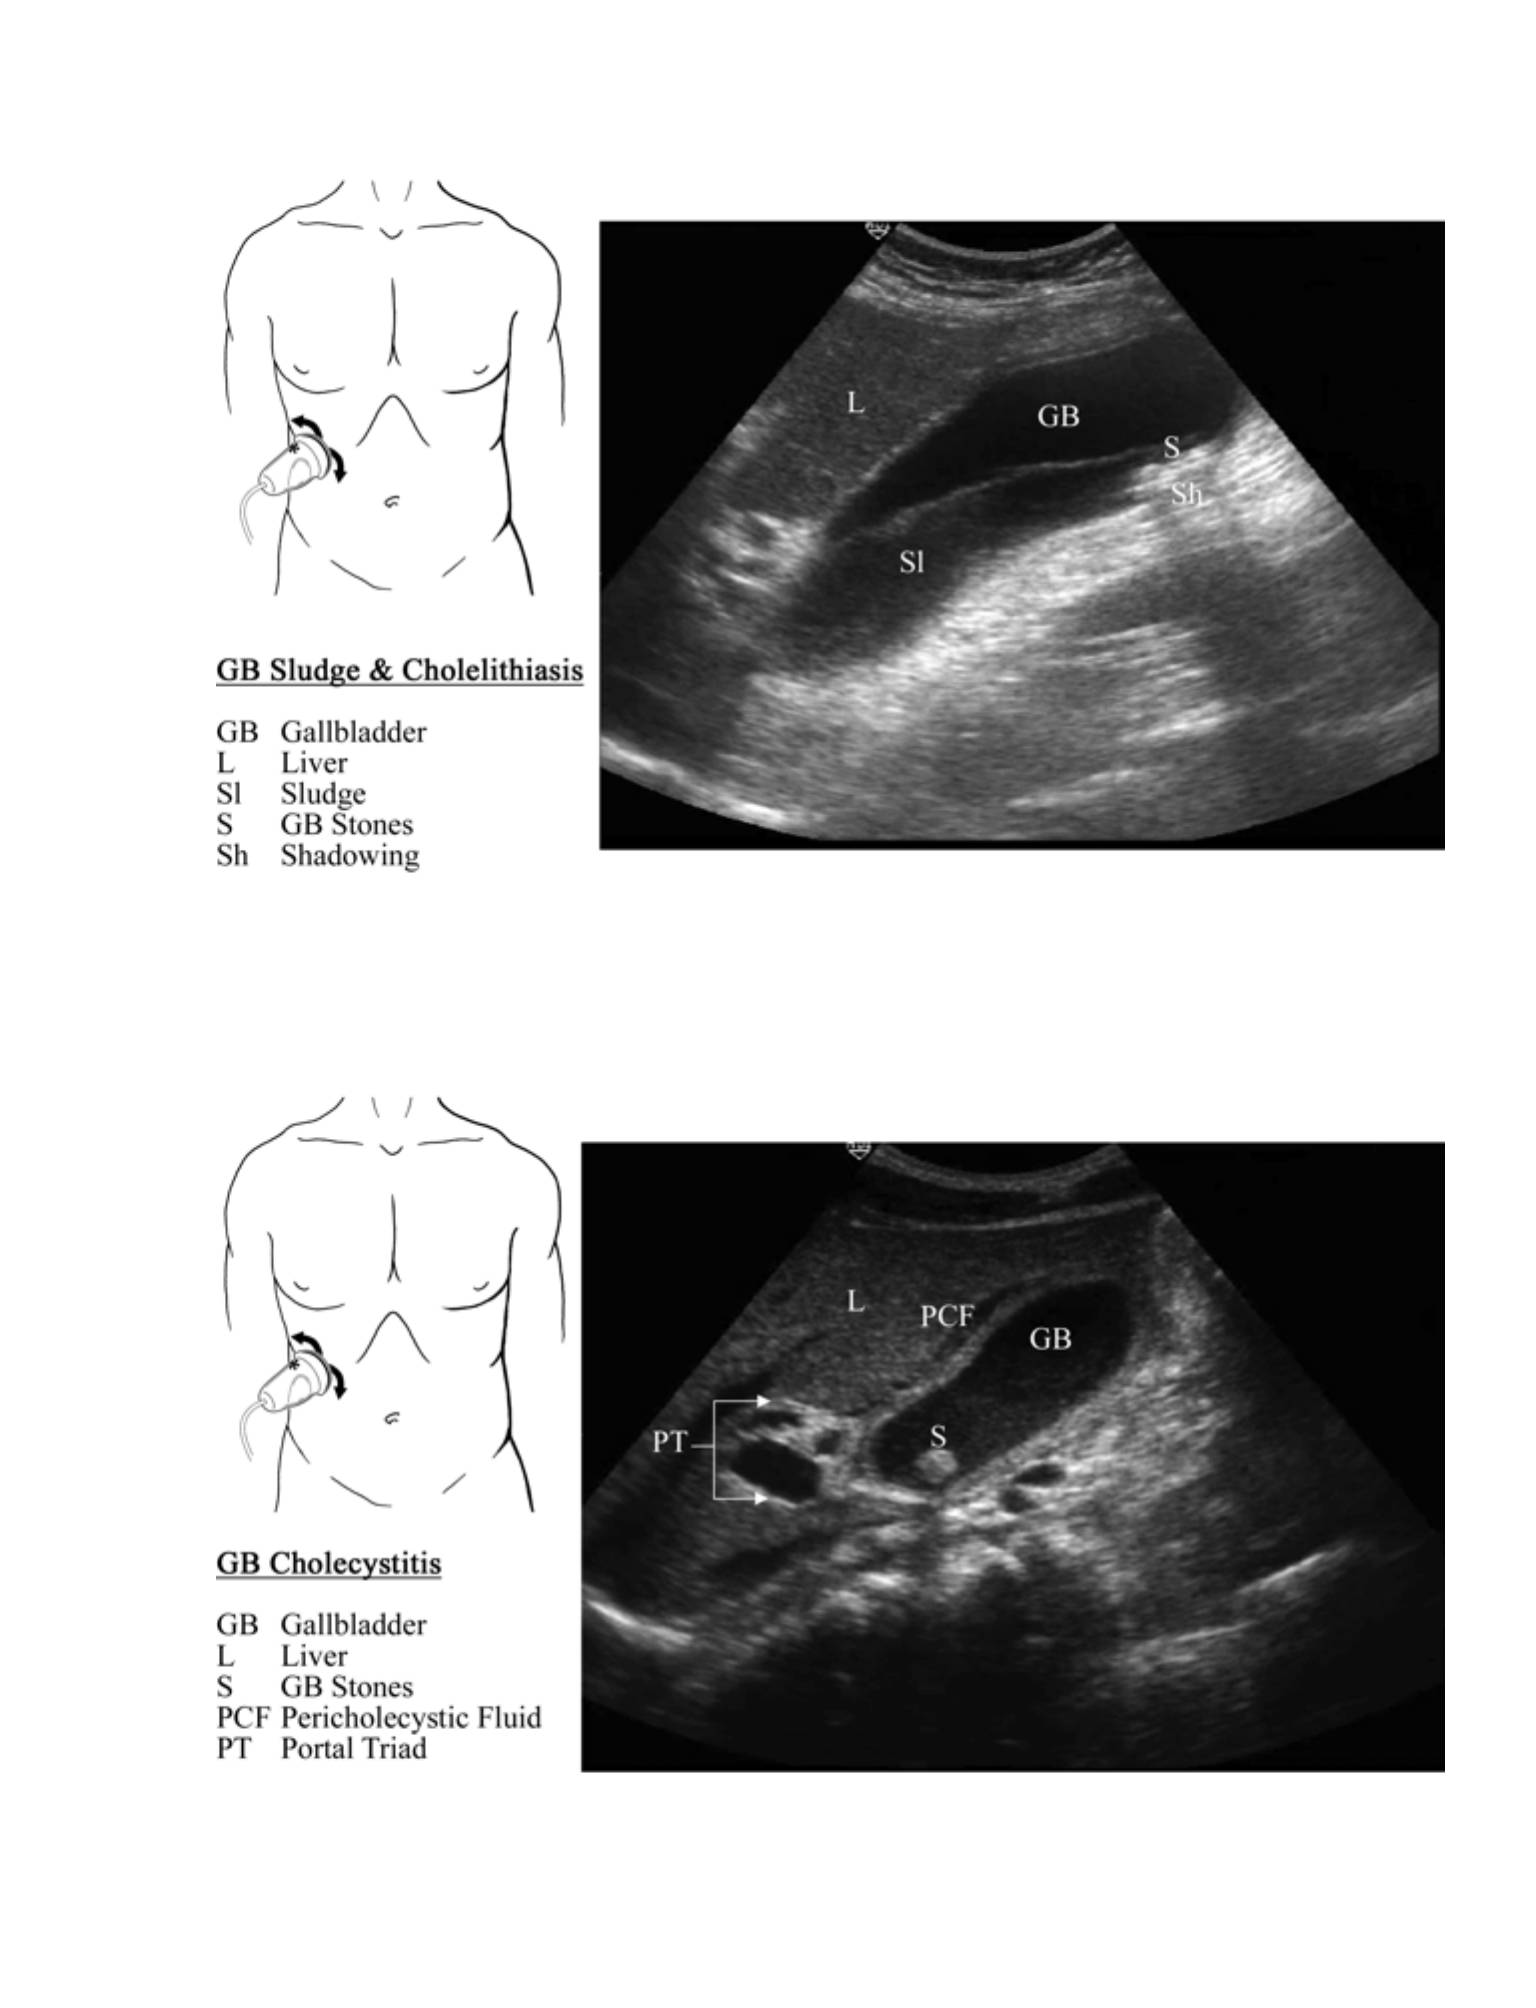
Pathology
•
Cholelithiasis
•
Gallbladder stones are hyperechoic structures within the gallbladder lumen
that generally exhibit posterior shadowing.
•
The patient may be rolled into the left lateral decubitus position in an
attempt to roll the stones out of the neck. Failure to dislodge suggests
an impacted stone.
•
Gallbladder Polyps
•
Appear similar to stones but are usually located in the body of the gallbladder
and do not move with body position changes
•
Sludge
•
Appears as a fluid level within the gallbladder and may contain small stones
•
Will layer predictably in a gravity-dependent fashion
•
Acute Cholecystitis
•
Suggested by the presence of:
•
Cholelithiasis
56

•
Thickened gallbladder wall
•
Normal thickness is < 3 mm.
•
Wall thickness of > 5 mm is abnormal.
•
Wall thickness of 3-5 mm may be abnormal, and clinical correlation is
required.
•
Pericholecystic fluid
•
“Hypoechoic (black) stripe between the liver and the gallbladder
•
Sonographic Murphy's sign
•
Pain while visualizing compression of the gallbladder
•
Chronic Cholecystitis
•
The result of numerous attacks of acute cholecystitis with subsequent fibrosis
of the gallbladder wall
•
Sonographically, the gallbladder is contracted with thickened walls.
•
Acalculous Cholecystitis
•
An acute inflammation of the gallbladder in the absence of cholelithiasis. Most
commonly this is found in conditions that produce depressed gallbladder
motility such as major trauma, burns, or postoperative patients.
•
Sonographically, the gallbladder wall is thickened and echogenic sludge is
seen within a dilated gallbladder.
•
Emphysematous Cholecystitis
•
Caused by gas-forming bacteria in the gallbladder
57

•
Sonographically, the gas released by the bacteria appears as a prominent
bright echo along the anterior wall with ring down or comet-tail artifact. If the
amount of gas in the gallbladder is large, the gallbladder may appear as a
curvilinear echogenic area with complete posterior fuzzy shadowing.
•
Gangrenous Cholecystitis
•
Occurs when there is vascular compromise of the gallbladder wall
•
Common sonographic features are the presence of diffuse coarse echogenic
densities filling the gallbladder lumen. The echogenic densities do not cause
shadowing, are not gravity dependent, and do not show a layering effect.
•
The Wall Echo Shadow (WES) Sign
•
The sonographic pattern of the gallbladder when packed with stones. Only
the anterior wall of the gallbladder will be imaged with the stones casting a
distinct acoustic shadow.
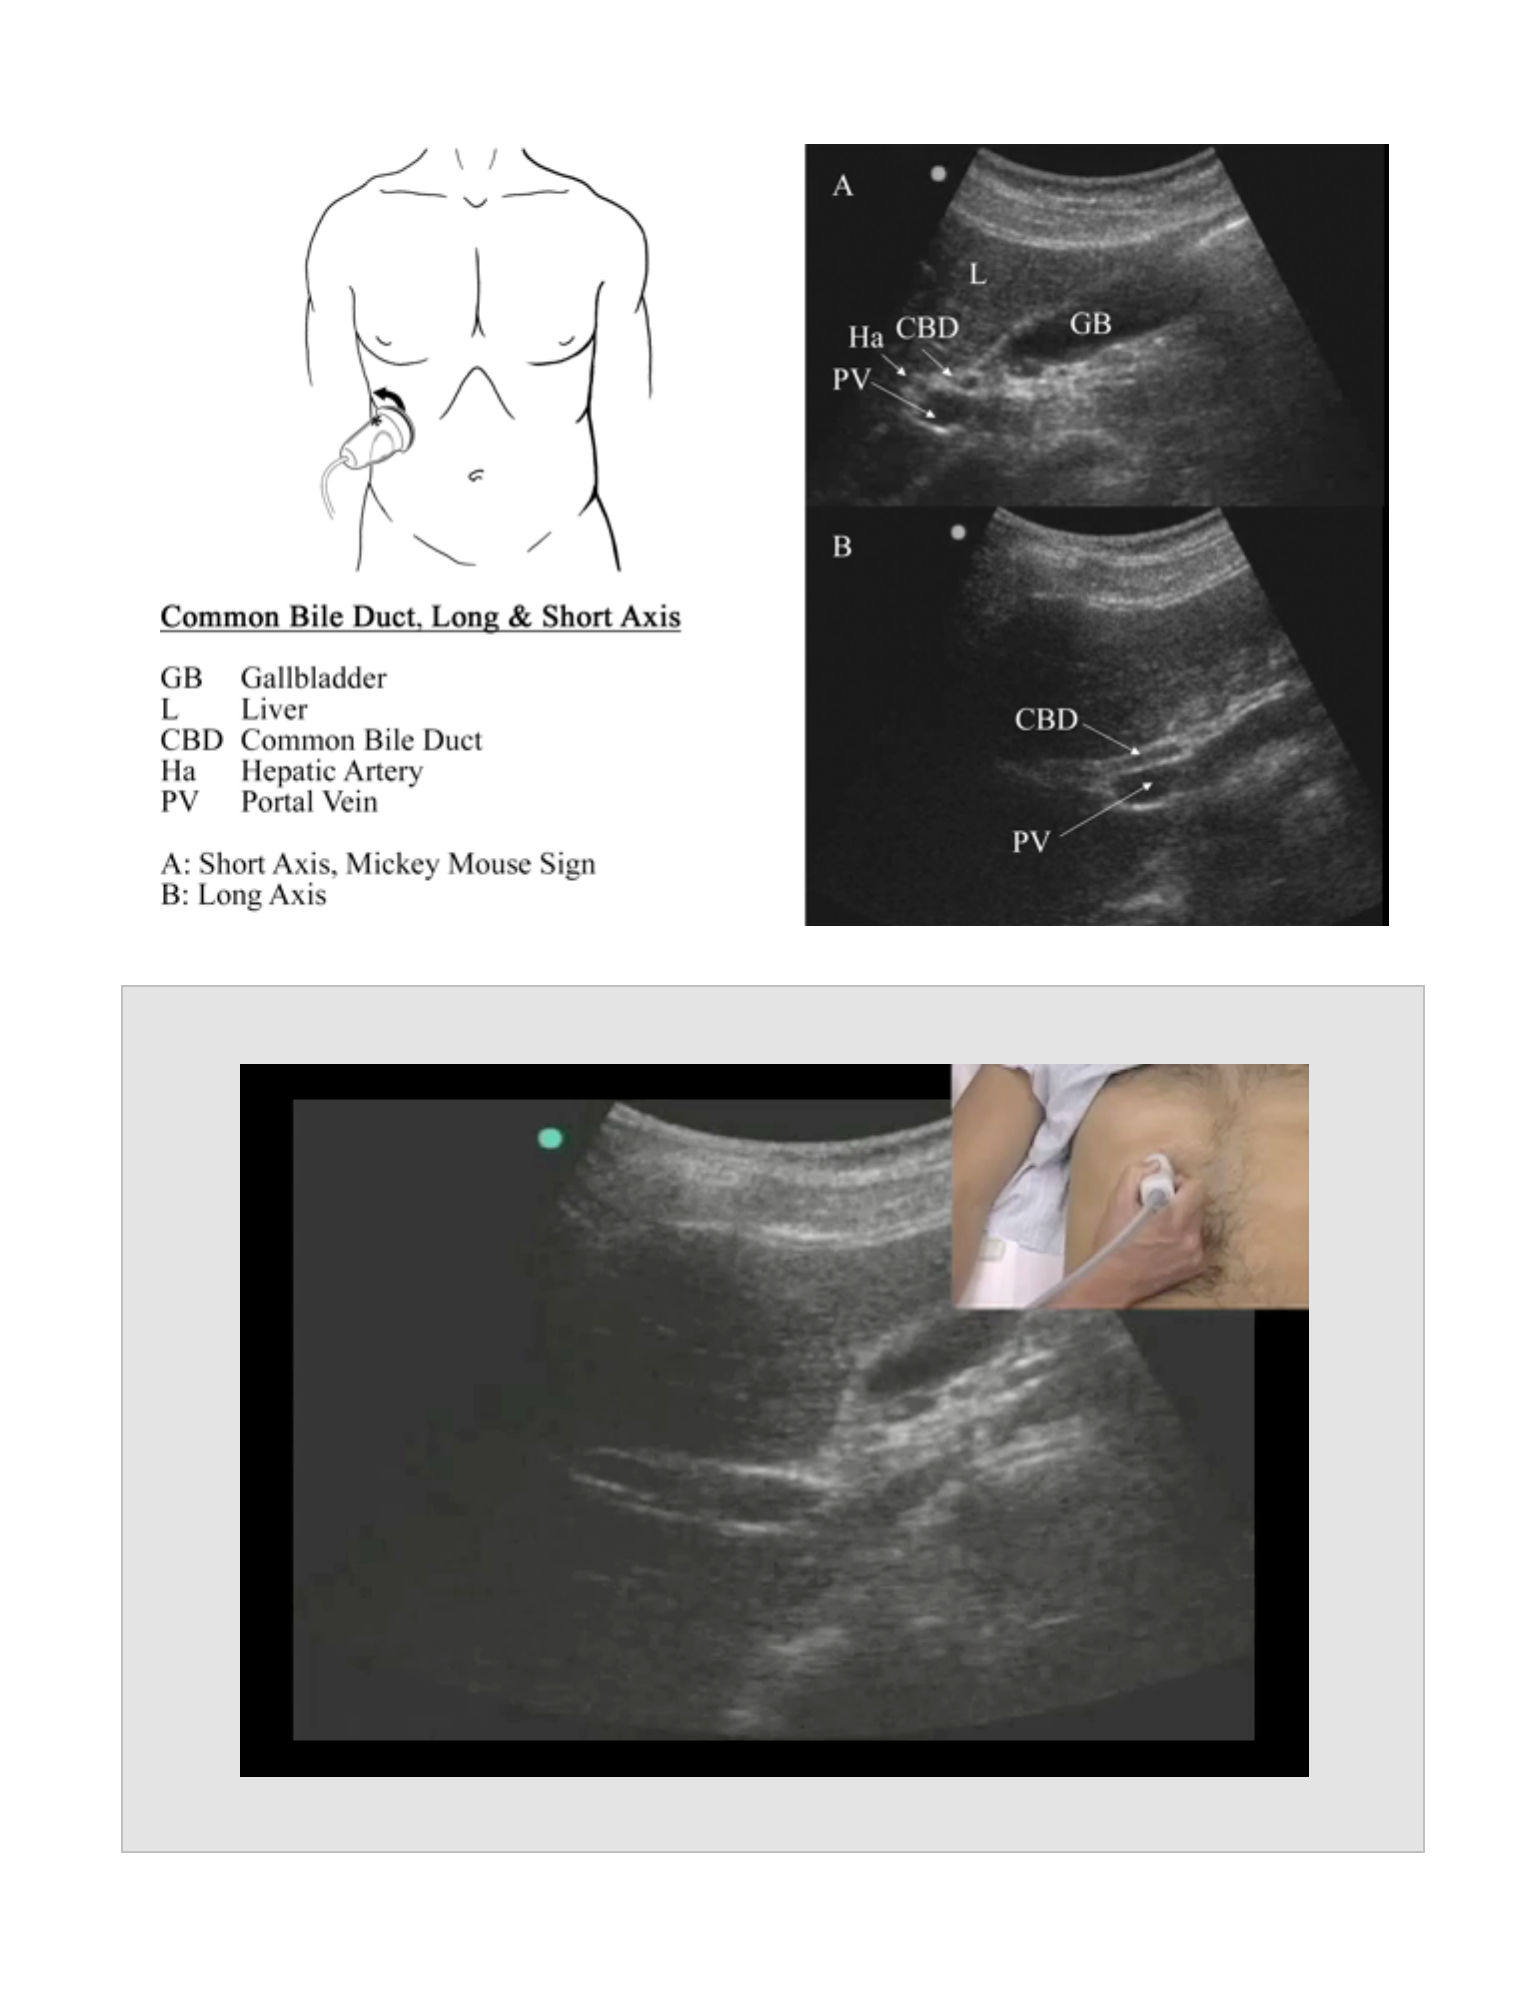
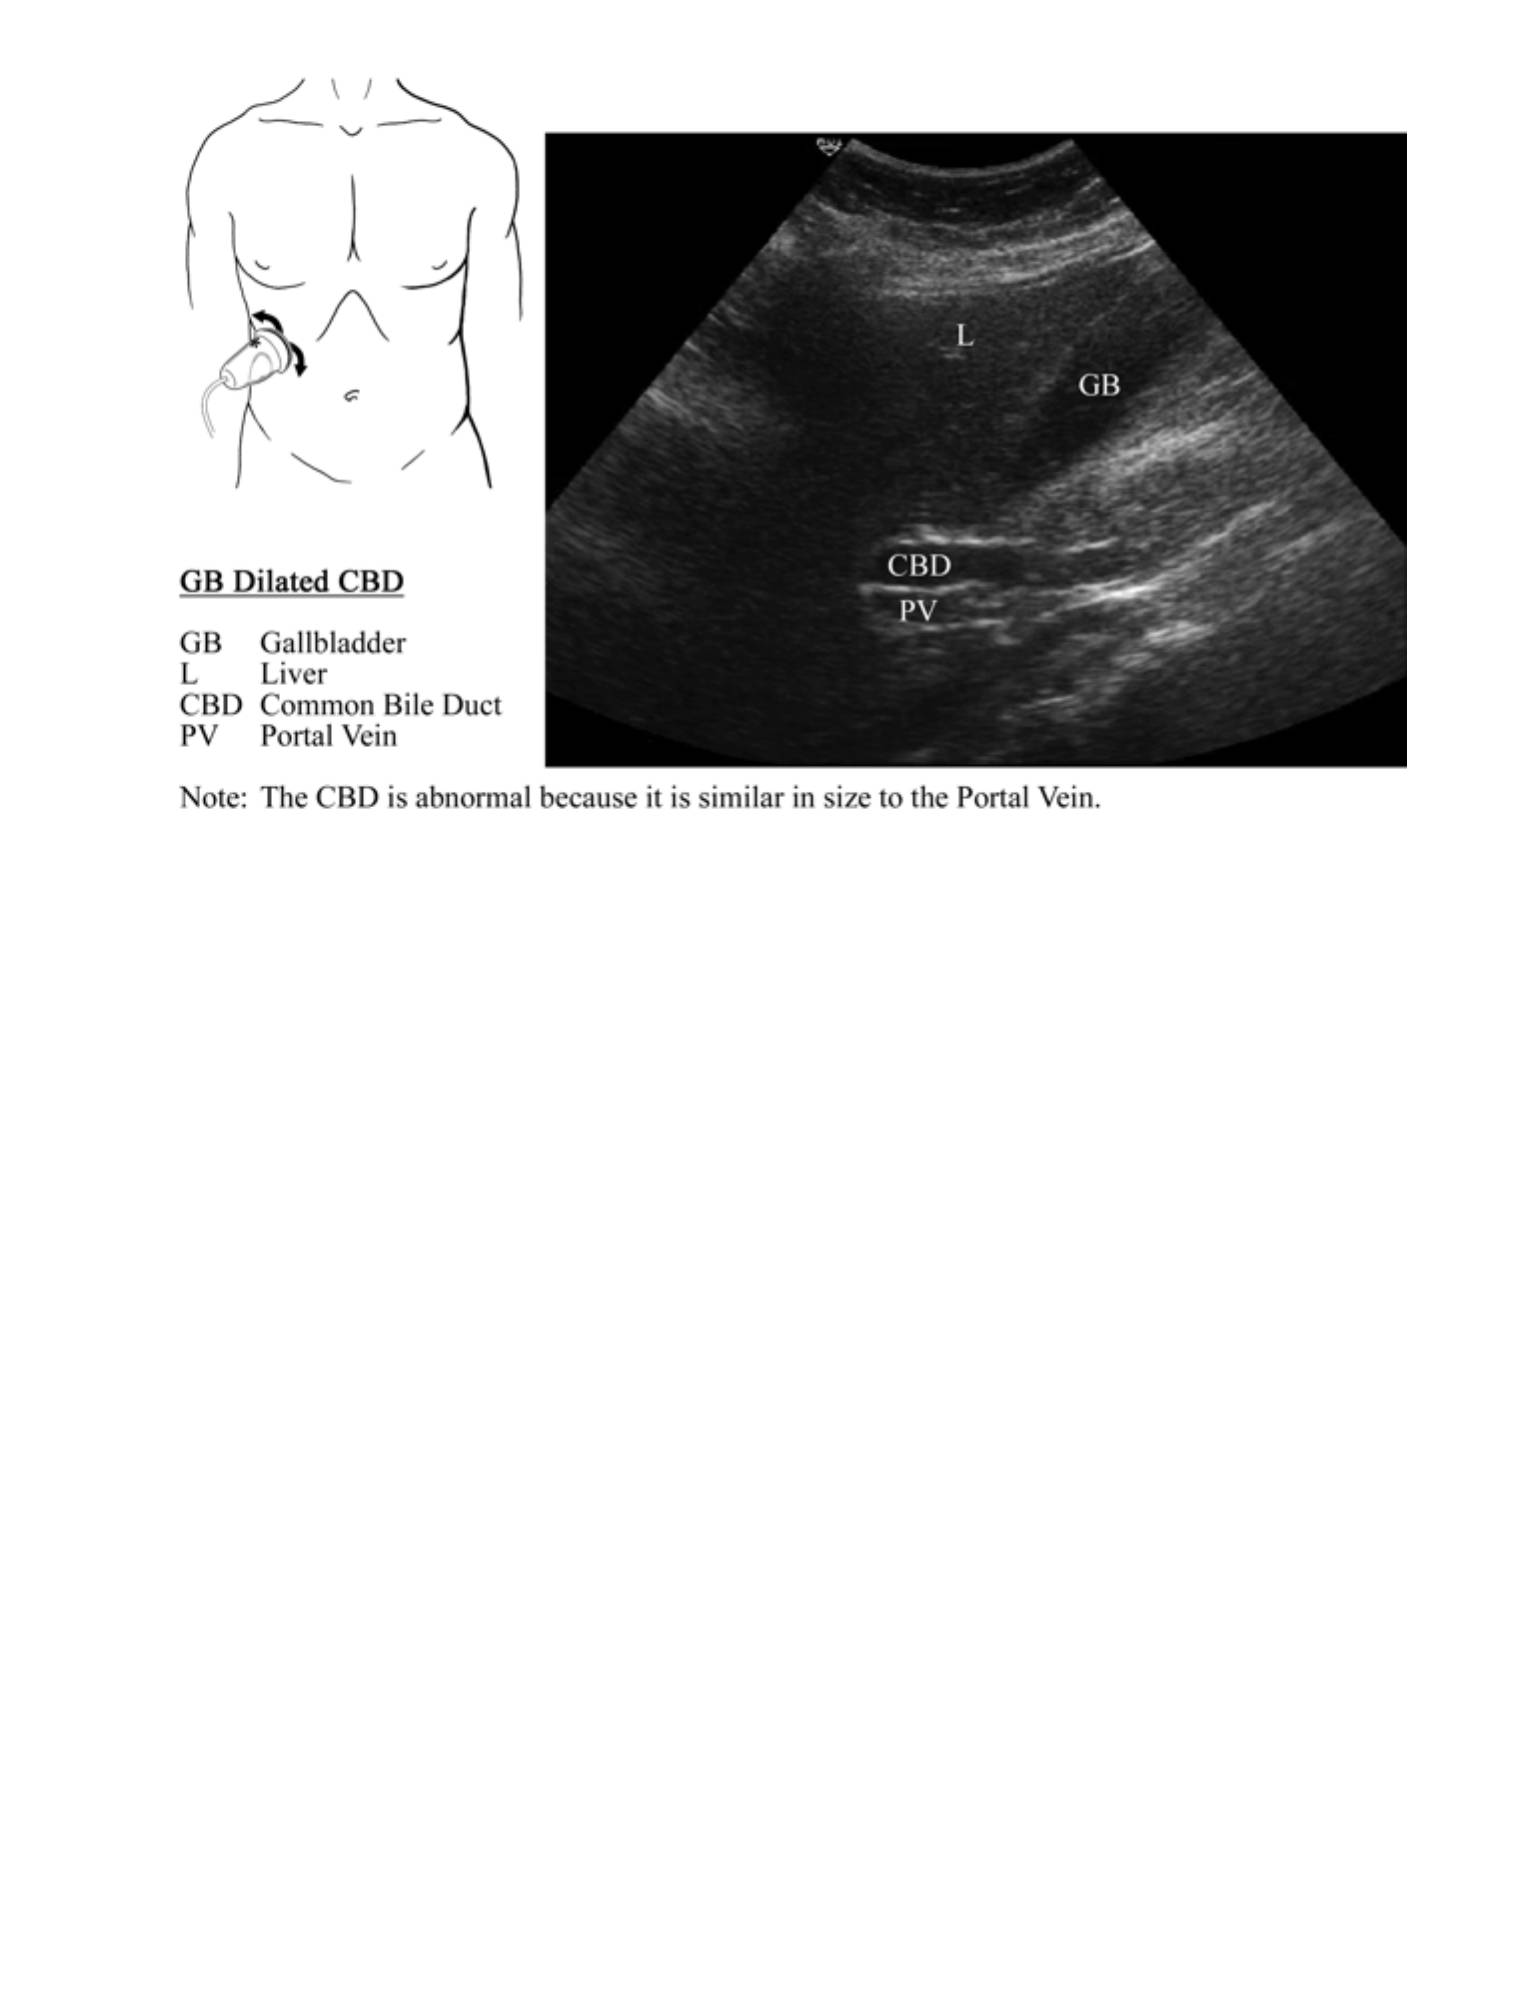
Common Bile Duct
Probe Placement
•
Locate the portal vein (hyperechoic walled vein) at the neck of the gallbladder. The
common bile duct (CBD) is part of the portal triad along with the portal vein and
the hepatic artery.
•
Rotate the probe into a longitudinal axis portal vein view. The CBD is found
anterior and parallel to the portal vein.
Anatomic Structures
•
In cross section, the portal triad appears as three hypoechoic circles (the Mickey
Mouse sign).
•
The hepatic artery can be difficult to differentiate from the CBD. The normal CBD is
similar in size to the hepatic artery.
58

•
Color or Power Doppler can be used to assist in confirmation of the CBD. Blood flow
should be seen in the portal vein and hepatic artery and not seen in the
CBD.Pathology
•
Proximal aortic aneurysms are rare. If a flap is seen in the lumen of the aorta, an aortic
dissection should be considered.
Pathology
•
CBD Dilation
•
Normal measurement of the CBD is less than 7 mm.
•
Normal size increases with age and in patients who have undergone
cholecystectomy. CBD >10 mm is usually pathologic.
•
Obstruction is the most common cause of CBD dilation.
•
Common causes of obstruction include impacted stone, obstructing masses
of the CBD or pancreas, or stricture of the CBD.
•
Non-obstructive causes of dilation of the CBD include cirrhosis and various
medications.
•
Choledocholithiasis
•
The presence of a stone in the CBD is an uncommon but serious finding. Due
to overlying duodenal bowel gas, the distal CBD is rarely seen. Since this is
the most likely place for CBD stone impaction, dilation of the CBD is an
indirect sign of possible choledocholithiasis.
Normal Measurements
•
The aorta normally tapers from proximal to distal with a maximal normal diameter of 3
cm as measured using an A-P cross sectional measurement from outside wall to
outside wall.
Reports
•
Gallbladder long axis with wall measurement and any stones
•
Gallbladder short axis
•
Common bile duct with measurement of diameter
•
Measurement is taken from the middle of one wall to the middle of the other, or
from the anterior surface of one wall to the anterior surface of the other.
•
Other pictures of stones and pericholecystic fluid as necessary
•
Comment on the presence of a sonographic Murphy's sign.
•
Other pictures of stones and pericholecystic fluid as necessary
59
•
Comment on the presence of a sonographic Murphy's sign.
Pearls
•
If there is difficulty visualizing the gallbladder in the supine position, roll the patient into
the left lateral decubitus position.
•
Patient positioning is critical for this exam. Use both supine and left lateral decubitus
positions liberally as the views complement one another.
•
Power Doppler can be used to differentiate the CBD from the hepatic artery.
Pitfalls
•
A contracted GB will appear to have a thickened wall, but it may be normal.
•
Gallbladder wall thickening (> 3 mm) may be seen in the setting of conditions
unrelated to the gallbladder such as cirrhosis, renal failure, congestive heart failure,
ascites, multiple myeloma, and hypoproteinemic states.
•
The spiral valves of Heister are located near the neck of the gallbladder and may
cause posterior shadowing. Thus, they may be confused with an impacted stone.
•
A patient's symptoms may not be related to cholelithiasis, as many patients have
stones but are asymptomatic. Always correlate ultrasound findings with the history
and physical examination.
Clinical Integration Diagram
60
Biliary Ultrasound
Surgical
consult
Outpatient
follow up
Cannot rule
out biliary
disease
Consider
another
cause
Abnormal
labs
Normal
labs
Abnormal
labs
Normal
labs
No cholelithiasis
No cholecystitis
Cholelithiasis
No cholecystitis
Consider
surgical
consult
Cholecystitis
61
Gallbladder Exam
Movie 6.1
62
Common Bile Duct Measurement
Movie 6.2
63
64
65
Renal Ultrasound Exam

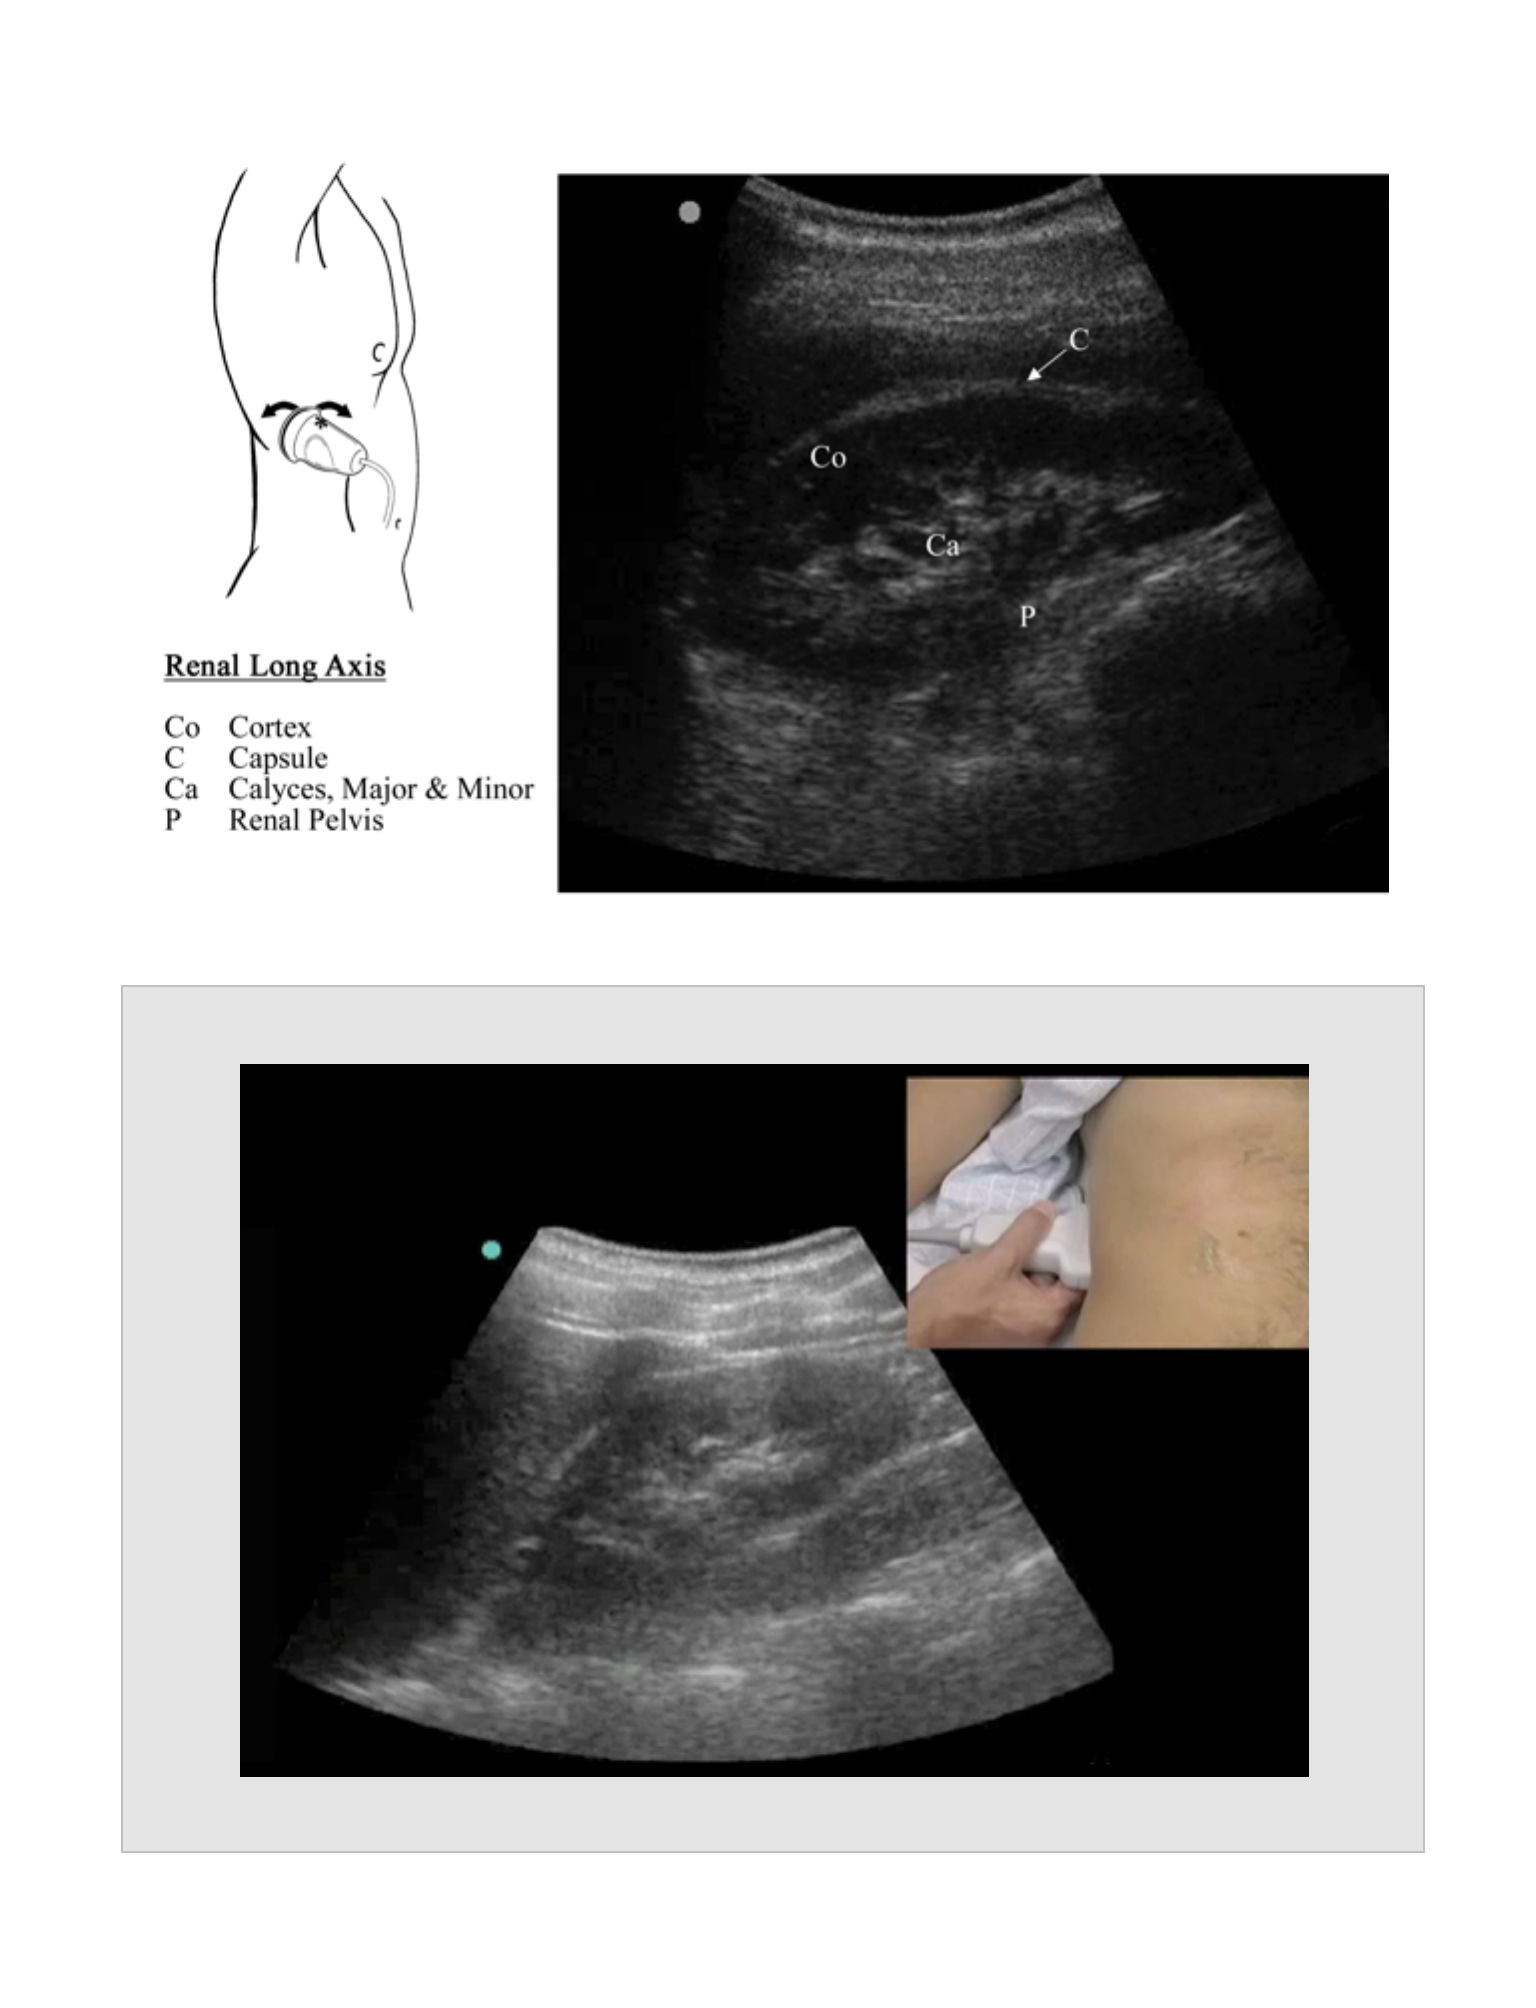
RENAL ULTRASOUND
EXAM
CHAPTER 7
66

67
Indications
•
Suspicion for renal colic or hydronephrosis
Goals
•
Primarily to evaluate for complications of renal colic, such as hydronephrosis
•
To evaluate for the presence of ureteral or intrarenal stones
•
To evaluate the bladder for post void residual urine
Probe
•
Curvilinear Abdominal probe (2-5 MHz)
•
Sector probe allows for visualization through the ribs, but does not provide a field
of view to visualize the entire kidney at one time
Patient Position
•
Place the patient in a supine position with the best images obtained by
visualization of the kidney through the liver or spleen.
•
The left or right lateral decubitus position may be useful for bringing the kidney
closer to the skin surface.
•
Instruct the patient to take a deep breath and hold it so that the kidney will move
caudally below the ribs.
Standard Views and Probe Position
Renal
Probe Placement
•
For the left kidney, place the probe in the left mid to posterior axillary line at or
near the 10th intercostal space with the indicator cephalad.
•
For the right kidney, place the probe in the right anterior to mid axillary line at or
near the 11th intercostal space with the indicator cephalad.
•
Once the kidney is located, orient the probe according to the kidney's axis, not
the true anatomical position.
•
Obtain the long axis view by panning the probe through the kidney, paying
particular attention to the renal hilum.
RENAL ULTRASOUND EXAM

•
Obtain short axis views by rotating the probe 90 degrees counter clockwise so
that the indicator is towards the patient's right. Pan the probe through the kidney.
•
Compare the appearance of the right and left kidneys using a split or dual screen
image. Note any hydronephrosis.
•
View overall renal architecture for consistency and presence of masses or renal
stones.
•
View proximal ureters, and note any hydroureter or ureteral stones.
Anatomic Structures
•
Visualize the following two portions of the kidney:
•
The outer hypoechoic parenchyma contains the cortex, the medulla, and the
medullary pyramids.
•
The inner hyperechoic sinus contains calyces, arteries, veins, and the entrance to
the kidney.
•
The renal hilum contains the renal pelvis leading to the ureter.
Pathology
•
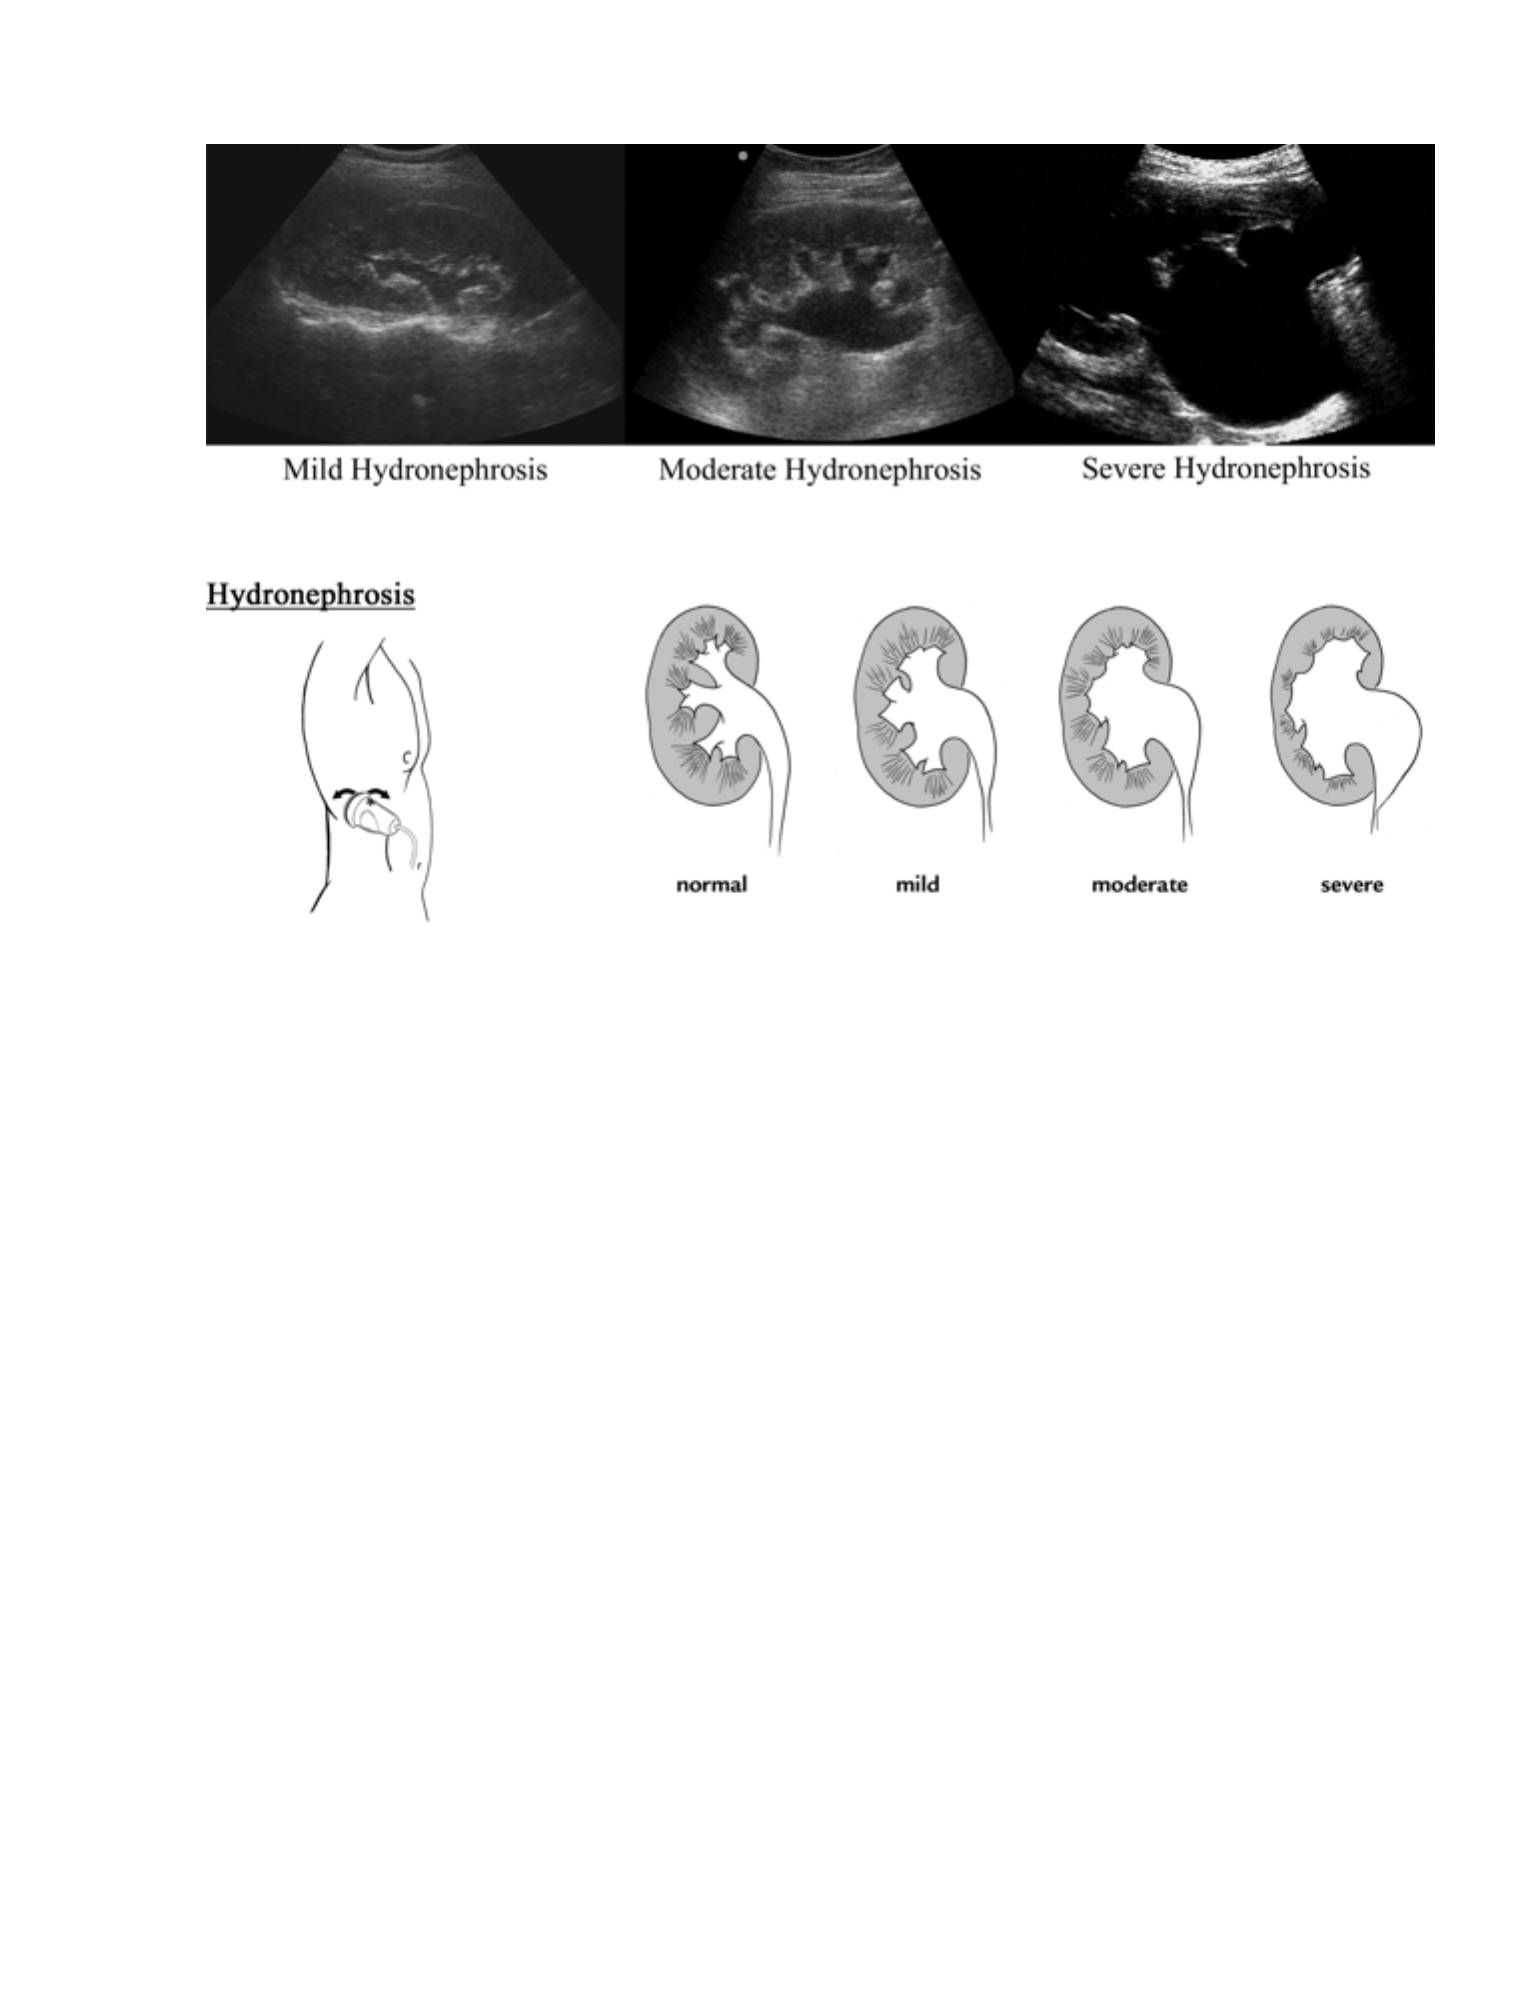
Hydronephrosis
•
A dilation of the renal collecting system which appears as a separation of
renal sinus echoes by interconnected fluid-filled areas
•
Grade as follows:
•
Grade 1 (mild) exhibits small separation or splaying of the calyceal pattern.
•
Grade 2 (moderate) exhibits further separation of the calyceal pattern
resembling a bear claw (Bear Claw pattern) with fluid extending into the major
and minor calyceal systems and thinning of the renal parenchyma.
68

•
Grade 3 (severe) exhibits severe dilation of the renal pelvis with thinning of
normal renal parenchyma.
•
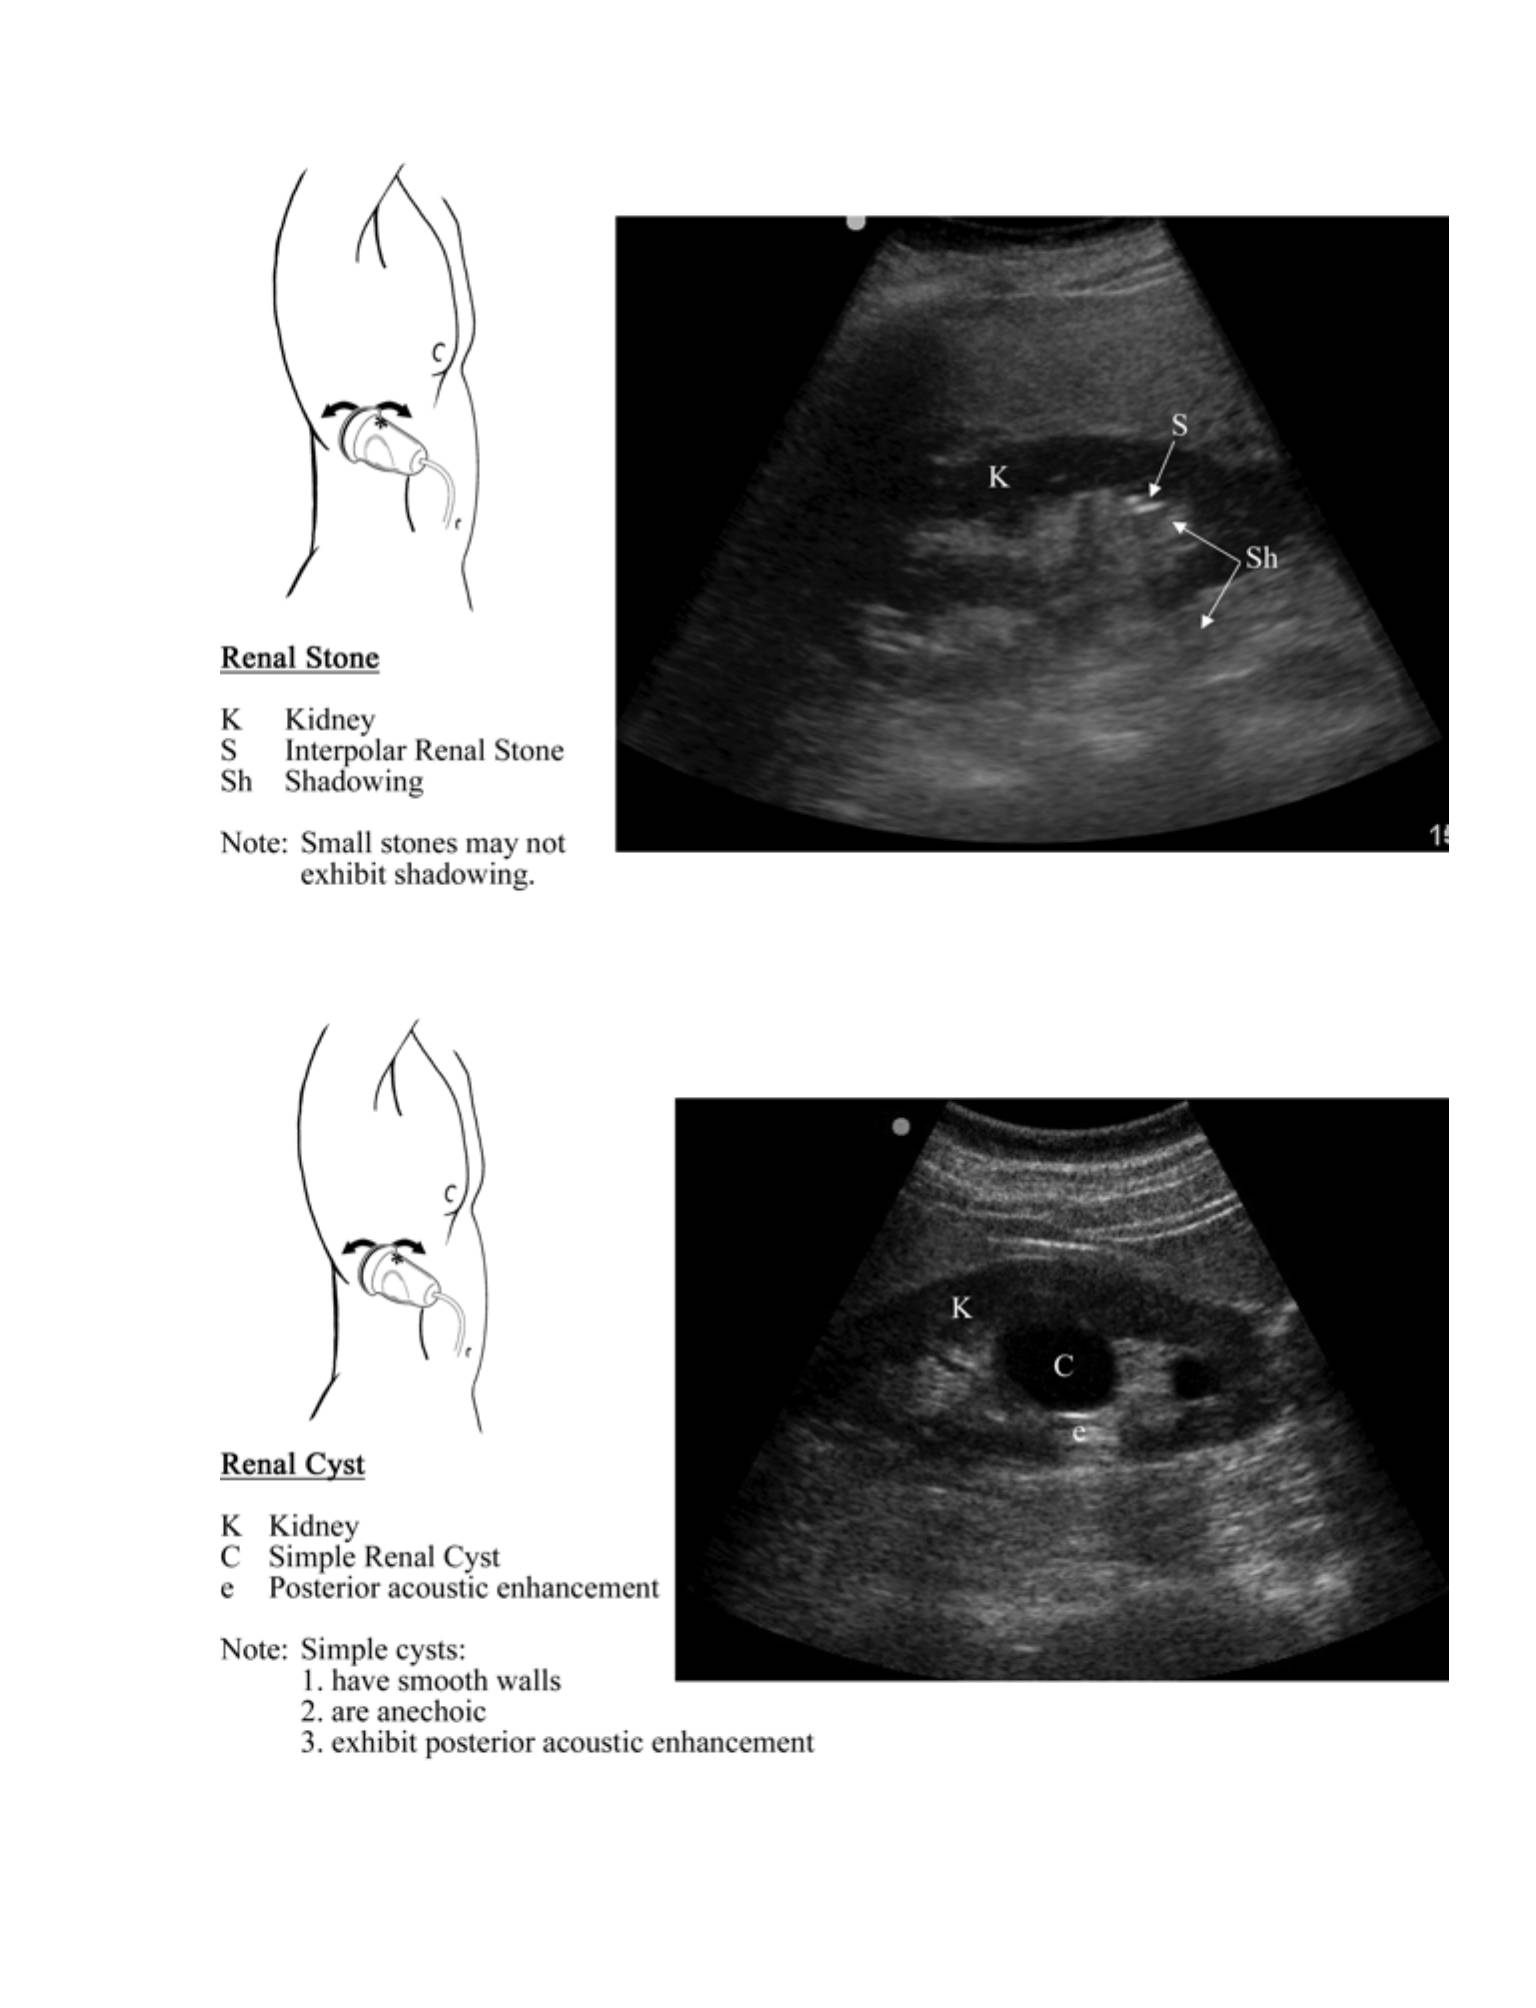
Renal stone (nephrolithiasis)
•
A renal stone is a hyperechoic focus within the renal parenchyma or pelvis.
•
Shadowing will depend on the size of the stone.
•
Renal stones smaller than 3 mm frequently do not exhibit shadowing.
•
Hydroureter
•
Dilated ureter
•
If caused by a ureteral stone, the stone is seldom seen due to lack of
visualization of the ureter due to overlying bowel gas.
•
Cysts
•
Intra-renal fluid collections which demonstrate characteristics of a cyst:
1) smooth walls, 2) anechoic, and 3) posterior acoustic enhancement.
•
Extra-renal fluid
•
Large perinephric fluid collections may represent a perinephric abscess or
extravasation of urine due to obstruction.
Bladder
Probe Placement
•
Above pubis angled inferiorly
•
Obtain both transverse (cross section with marker to the right) and longitudinal
(long axis with marker cephalad) views.
69

"
Anatomic Structures
•
Visualize the hypoechoic (black) bladder with the uterus posterior and superior to
the bladder in females and the prostate posterior to the bladder in males.
Pathology
•
A residual volume of less than 20 ml of urine is considered normal in an adult.
Amounts greater than this need to be correlated with the clinical scenario.
•
Bladder volume measurement can be estimated by H (height) x W (width) x D
(depth) x 0.5
Normal Measurements
•
Long axis: 10-12 cm
•
Short axis: 5 cm
•
“Normal bladder wall thickness is 5 mm when empty and 3 mm when full
Reports
•
Long and short axis through kidney with a comparison image from the other side
•
Stone, hydronephrosis, hydroureter, mass, or other images of concern
•
Post void residual bladder volume, if applicable
Pearls
•
If it is unclear whether hydronephrosis is present, compare images between both
sides (ideally with a split screen).
•
Hydration using IV fluids increases the sensitivity of the renal exam for the
detection of hydronephrosis.
•
70
Pitfalls
•
Non-obstructive hydronephrosis (false-positive hydronephrosis)
•
Dilation of the renal pelvis does not always mean that obstruction is present.
Other conditions that may lead to dilation of the renal pelvis include
vesicoureteral reflux, infection, large extrarenal pelvis, high flow states
(polyuria), distended bladder, or pregnancy (the enlarged uterus can compress
the ureter).
•
False-negative hydronephrosis
•
Renal colic is often associated with vomiting that may lead to dehydration and
an underestimation of the degree of hydronephrosis. Hydronephrosis takes
time to develop, and collection system dilation may not be seen for several
days in the setting of distal ureteral calculi. A staghorn calculus can also mask
an associated dilation.
•
Occasionally, kidneys may be located in the pelvis.
•
Occasionally, patients may have a solitary kidney.
•
The amount of hydronephrosis does not always correlate with the amount of
obstruction or to stone size.
•
Grade 1 (mild) hydronephrosis can be confused with normal renal vessels in the
peripelvic area. The kidneys in a well-hydrated patient can appear to have a mild
hydronephrosis. This appearance, however, occurs in both kidneys.
Clinical Integration Diagram
71
Consider non-contrast CT
Consider other cause for pain
No hydronephrosis or
hydroureter
Hydronephrosis or
hydroureter
Renal
Ultrasound
Consider ureterolithiasis or
other obstruction
72
Renal Exam
Movie 7.1
73
74
Gynecological Ultrasound Exam

GYNECOLOGICAL
ULTRASOUND EXAM
CHAPTER 8
75

76
Indications
•
Lower abdominal pain in the female patient which could be consistent with an
ovarian cyst
Goals
•
To visualize the adnexa in order to diagnose an ovarian cyst
•
Risk stratification for the presence of an ovarian torsion and to evaluate for a
mass or tubo-ovarian abscess (TOA)
Probe
•
Transvaginal: Endocavitary probe (4-8 MHz)
Patient Position
•
Transvaginal: lithotomy position
Standard Views and Probe Position
Transvaginal
Probe Placement
•
Having an empty bladder is essential. A full or partially full bladder will cause
discomfort when using the endocavitary probe. Further, urine in the bladder will
cause displacement of the uterus and ovaries, increasing the difficulty in
visualizing these structures.
•
“The probe is inserted into the vagina with the marker pointed towards the
bladder (ceiling). If the probe is correctly aligned, the bladder should be seen on
the left side of the monitor. The bladder should be seen by pointing the probe
towards the ceiling (lowering the scanning hand), and the cul-de-sac should be
seen by pointing the probe towards the floor (raising the scanning hand). The
uterus is usually in mid position and is viewed by panning the probe from side to
side.
•
The probe is rotated 90 degrees counter-clockwise so the marker is towards the
patient's right.
GYNECOLOGICAL
ULTRASOUND EXAM

•
Visualization of the uterine and adnexal structures is accomplished by panning the
probe up and down.
•
The bladder should be seen by pointing the probe towards the ceiling (lowering
the scanning hand), and the cul-de sac should be seen by pointing the probe
towards the floor (raising the scanning hand).
Anatomic Structures
•
The alignment of the uterus is variable.
•
The uterus is typically anteflexed and anteverted, up above the bladder. It may,
however, be retroflexed (flexed away from the bladder) or retroverted (uterus
pointing towards the back). Further the uterus may be twisted or angled to one
side. It is essential to identify the long axis of the uterus by identifying the
endometrial stripe as a hyperechoic line within the uterus. The hyperechoic line
should be seen starting near the fundus and extending to the cervix. Finding the
hyperechoic line may require that the probe be angled to one side and/or rotated
slightly. The long axis of the uterus is seldom lined up exactly with the long axis of
the body.
•
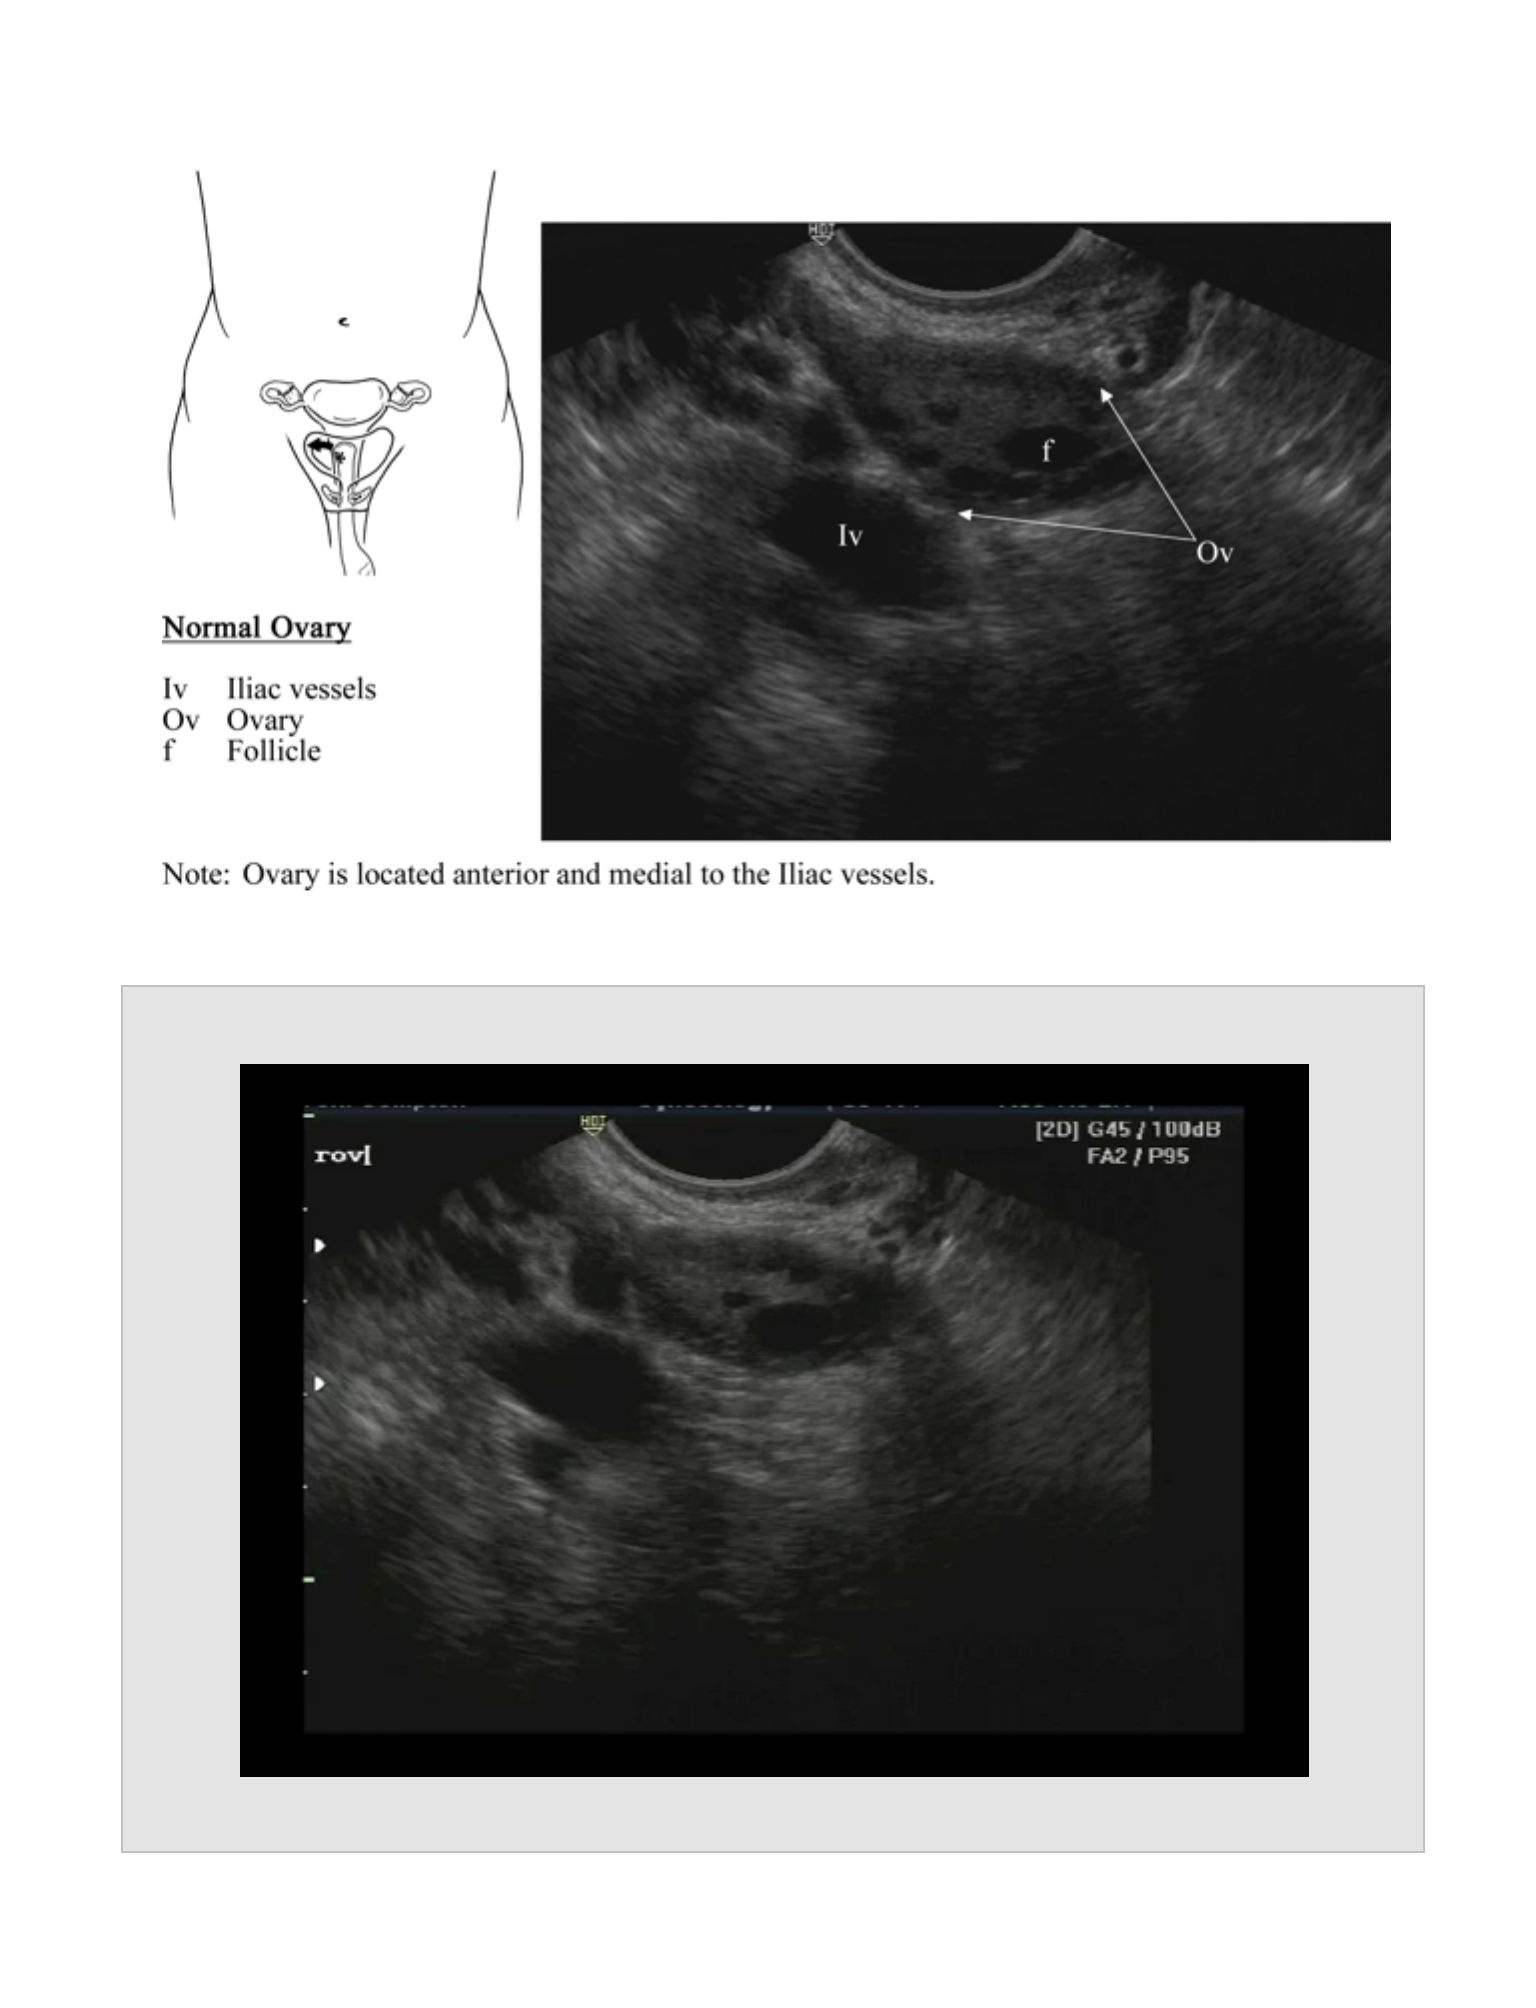
The ovaries can be found by angling the probe to the left or right (for the left or
right ovary respectively) while in cross section (the indicator pointed to the
patient's right). To find the ovaries, keep the uterus to one side of the screen, and
pan up and down each side of it. Typically the ovaries (hyperechoic structures
with hypoechoic follicles) are located lateral to the uterus and medial and anterior
to the iliac vessels (hypoechoic tubular structures).
Pathology
•
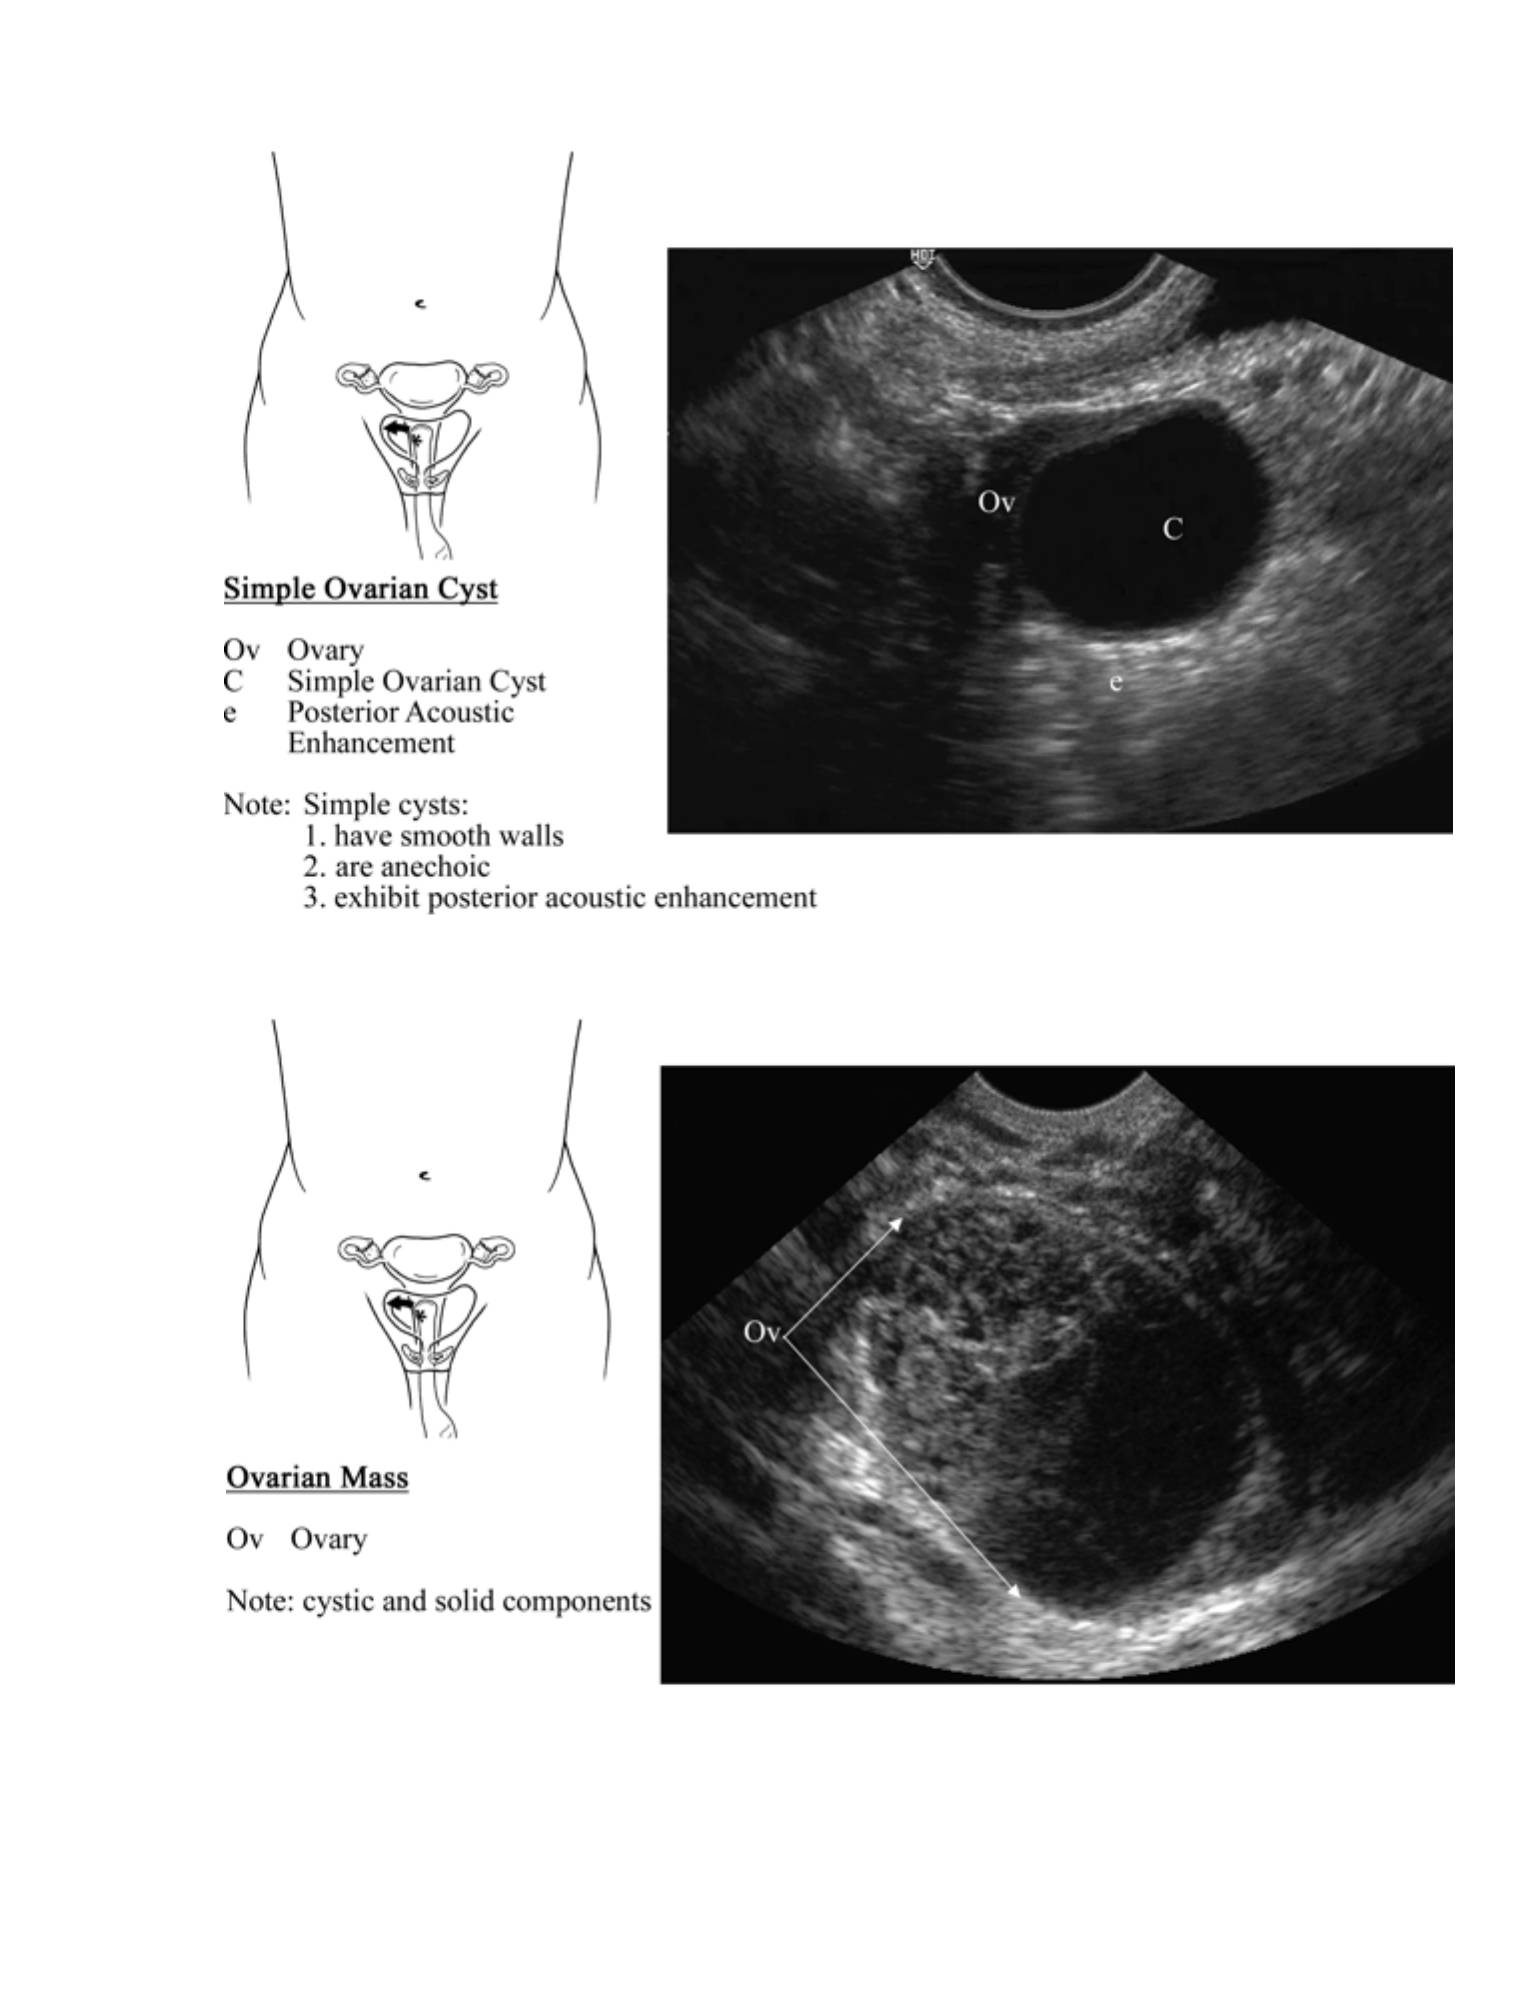
Cyst
•
A cyst is an abnormally large follicle. Variations exist as to at what size a
follicle becomes a cyst, but certainly 3 cm is the upper limit for a normal
follicle size.
77

•
Simple Cysts
•
Demonstrate qualities of cystic structures: 1) no internal echoes, 2) smooth
walls, and 3) posterior acoustic enhancement.
•
Complex cysts
•
Do not meet at least one of these criteria for simple cysts.
•
Hemorrhagic cysts contain hyperechoic internal echoes and may exhibit a
fishnet appearance, retracting clots, or a fluid fluid level.
•
Complex cysts may also represent a tubo-ovarian abscess (TOA) or
malignancy.
•
Ovarian Torsion
•
A torsed ovary is typically enlarged (greater than 4 cm) and heterogeneous in
appearance owing to edema, hemorrhage, and necrosis.
•
Free fluid is often present in the pelvis with ovarian torsion.
•
Ovarian torsion is rare unless an adjacent adnexal mass or an ovacian cyst
greater than 3-4 cm is present. If suspicion for ovarian torsion persists,
however, further diagnostic evaluation is warranted.
•
Demonstration of ovarian blood flow using
•
Doppler ultrasound does not rule out the possibility of torsion.
•
Pelvic Inflammatory Disease (PID)
•
Purulent material in the cul-de-sac appears as echogenic fluid
•
It has a similar appearance to pelvic blood.
78

•
Pyosalpinx
•
Echogenic fluid (purulent material) in a dilated fallopian tube
•
Tubo-ovarian Abscess (TOA)
•
Appears as a peri-uterine or adnexal mass, possibly with layering of
echogenic fluid and gas within the mass
•
A TOA should be suspected in the non-pregnant female with clinical signs or
symptoms of PID and an adnexal mass by ultrasound.
Normal Measurements
•
Ovaries: 2 x 3 x 4 cm
•
Follicle: Dominant follicle is normal up to 3 cm in diameter
Reports
•
Long and short axis through the uterus with demonstration of the endometrial
stripe
•
Both ovaries in long and short axis
•
“Any adnexal masses or cul-de-sac fluid
Pearls
•
Transvaginal US orientation can be confusing. Think of the probe as a flashlight,
and point the probe in the direction in which you are interested. If you become
lost, return to the longitudinal uterus view to reorient yourself.
•
Any complex cyst should have gynecological follow up to rule out ovarian cancer.
Ovarian lesions with irregular walls, thick irregular septations, mural nodules, and
solid echogenic elements are concerning for malignancy.
79
•
A torsed ovary is typically enlarged (greater than 4 cm) and heterogeneous in
appearance due to edema, hemorrhage, and necrosis. Free fluid is often present
in the pelvis. Adnexal masses or cysts less than 3-4 cm in diameter rarely cause
torsion. Clinical judgment should be used, however, in deciding whether
additional diagnostic tests are needed to further evaluate for ovarian torsion.
Pitfalls
•
A complex adnexal mass may represent a complex cyst (which may cause
torsion), a malignancy, or a TOA.
•
Diagnosis of ovarian torsion is complex. Full understanding of Doppler function is
essential and beyond the limits of typical emergency ultrasound skills. However,
the probability of ovarian torsion being present without an ovarian cyst or adnexal
mass is very low. If an ovarian cyst or adnexal mass is present, further diagnostic
testing is warranted. Due to the dual blood supply to the ovary, blood flow may be
detected in a torsed ovary. The presence of arterial flow, venous flow, or even
both does not exclude the diagnosis of torsion.
Clinical Integration Diagram
80
Gynecologic
Ultrasound
Gyn consult for
possible torsion
Gyn consult for
- TOA
- Hemorrhagic cyst
- Cancer
- Torsion
Complex
cyst/mass
Suspected
torsion?
Simple
cyst
Yes
Pain control
& follow-up
No
81
82
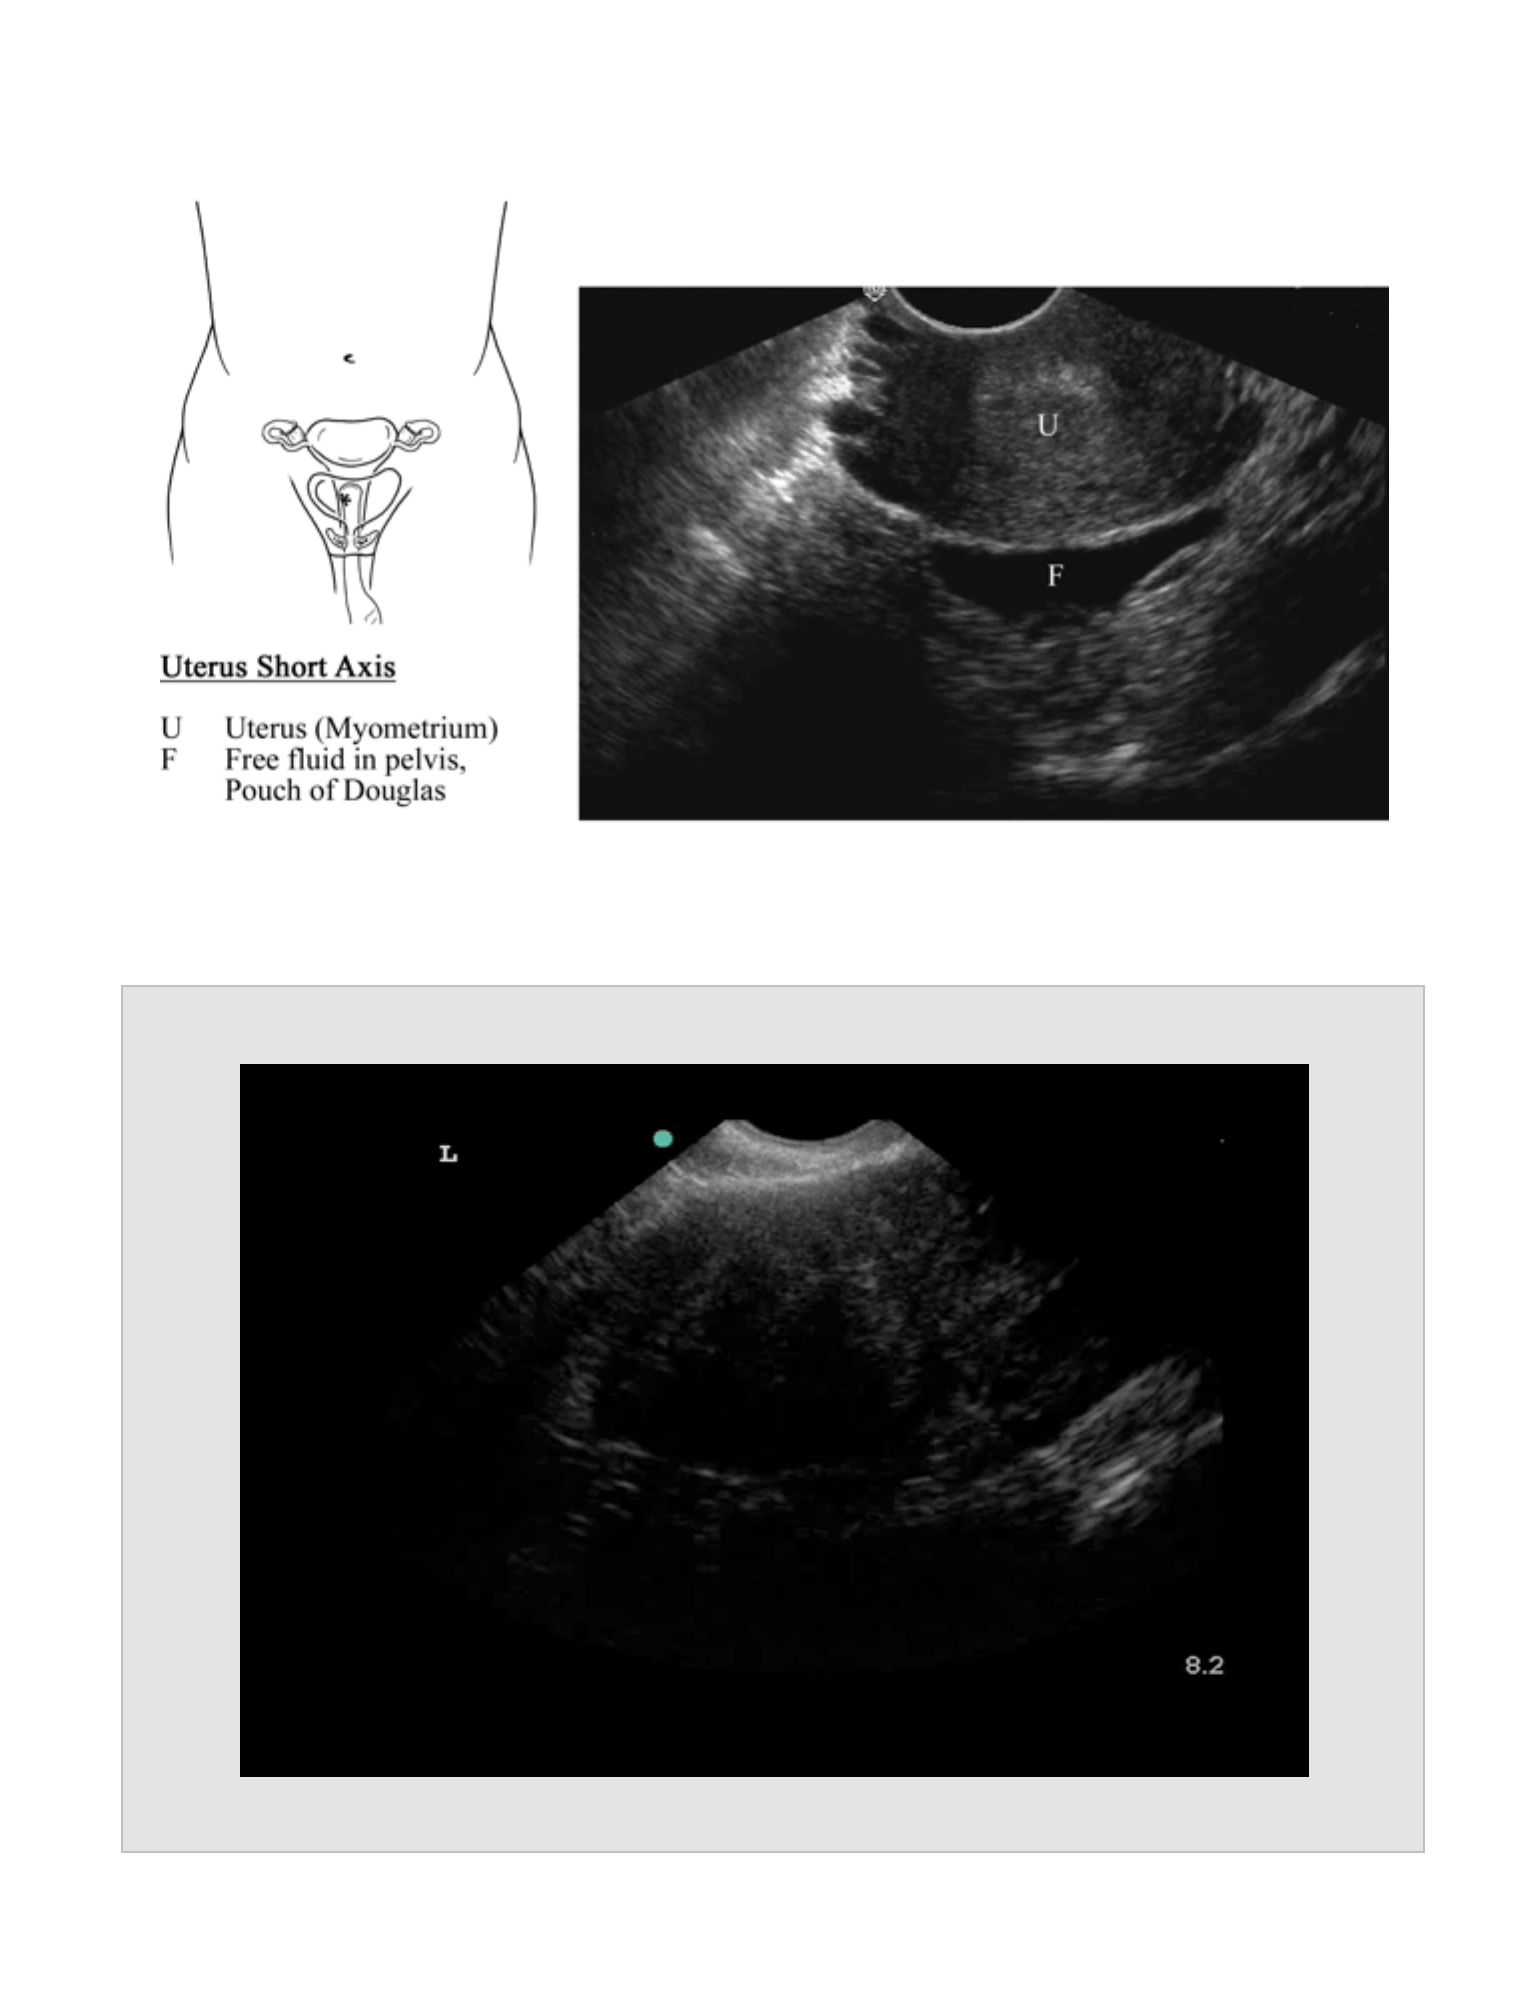
Long Axis Uterus (Transvaginal US)
Movie 8.1
83
Normal Ovary
Movie 8.2
84
Obstetric Ultrasound Exam

OBSTETRIC
ULTRASOUND EXAM
CHAPTER 9
85

86
Indications
•
First trimester abdominal pain, vaginal bleeding, syncope, or shock
Goals
•
To visualize an intrauterine pregnancy (IUP), thereby virtually eliminating the
presence of an ectopic pregnancy
•
Risk stratification for the possibility of an ectopic pregnancy with an empty uterus
•
Evaluating for extrauterine fetal heart beat (definite ectopic), adnexal masses
(probable to highly probable ectopic), pelvic fluid (possible ectopic), or blood
(probable ectopic)
Probe
•
Transabdominal: Curvilinear Abdominal probe (2-5 MHz)
•
Transvaginal: Endocavitary probe (4-8 MHz)
Patient Position
•
Transabdominal: supine
•
Transvaginal: lithotomy position
Standard Views and Probe Position
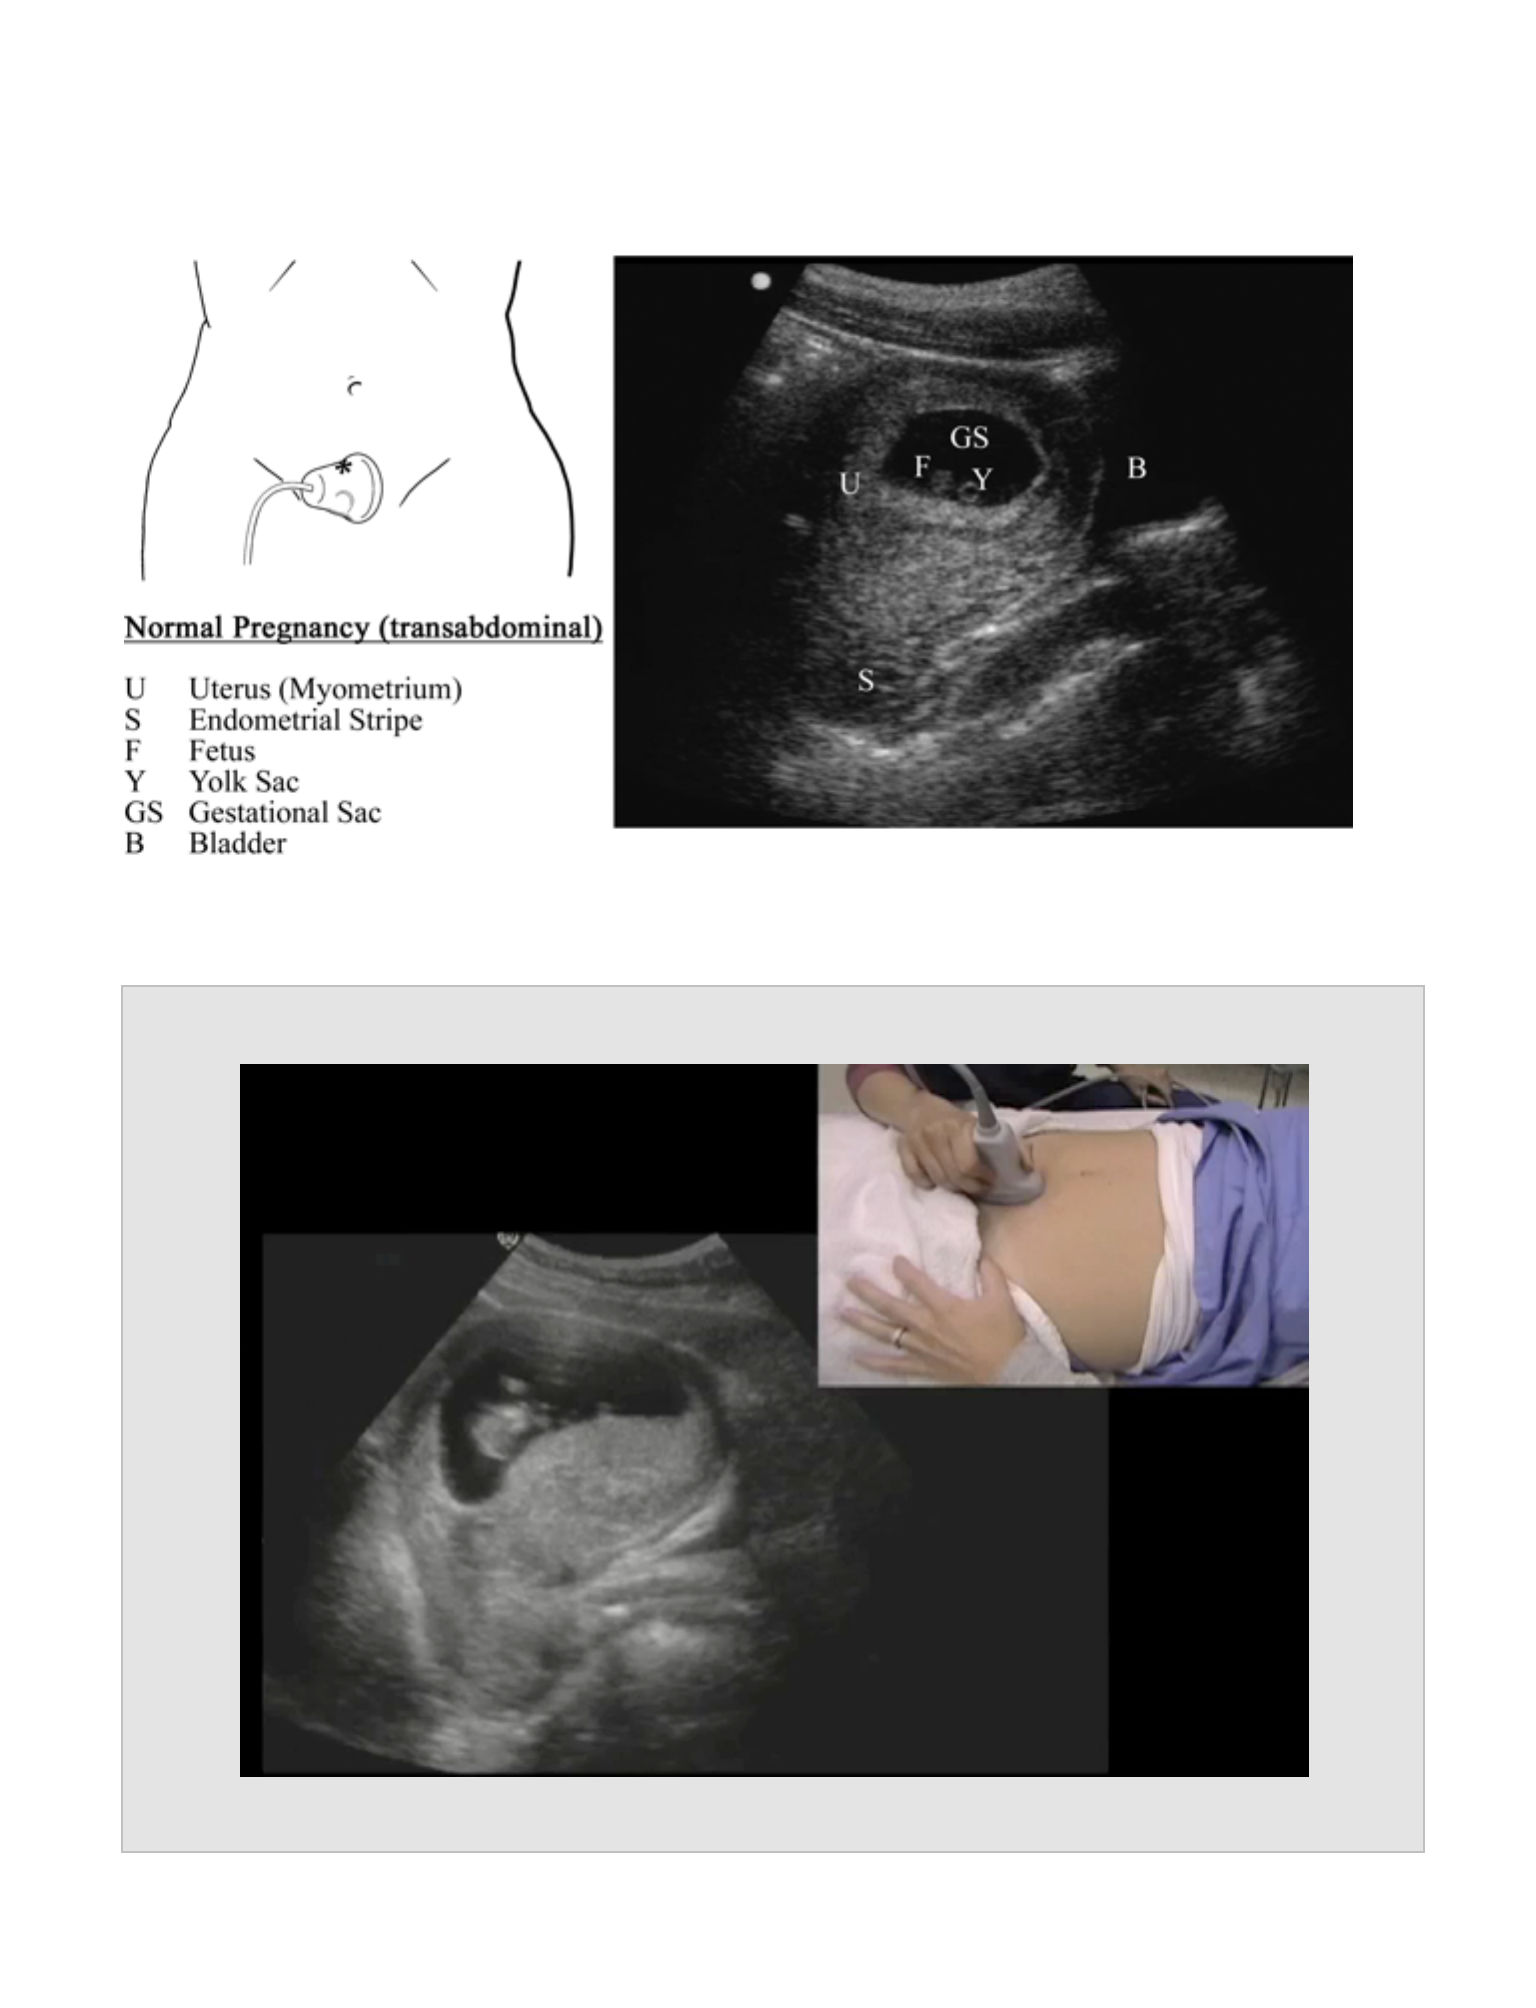
Transabdominal
Probe Placement
•
Having a full bladder is essential. The bladder acts as a window for the ultrasound
beam to visualize the uterus and the uterine contents.
•
“The probe is placed above the pubis in long axis with the marker cephalad. It is
essential to pan the probe from left to right to left to visualize the full extent of the
uterus and peri-uterine structures.
•
The probe is rotated counter-clockwise with the marker pointing to the patient's right.
Cross sectional uterine images (from the cervix to the fundus) are obtained by
panning up and down
OBSTETRIC ULTRASOUND
EXAM

Anatomic Structures
•
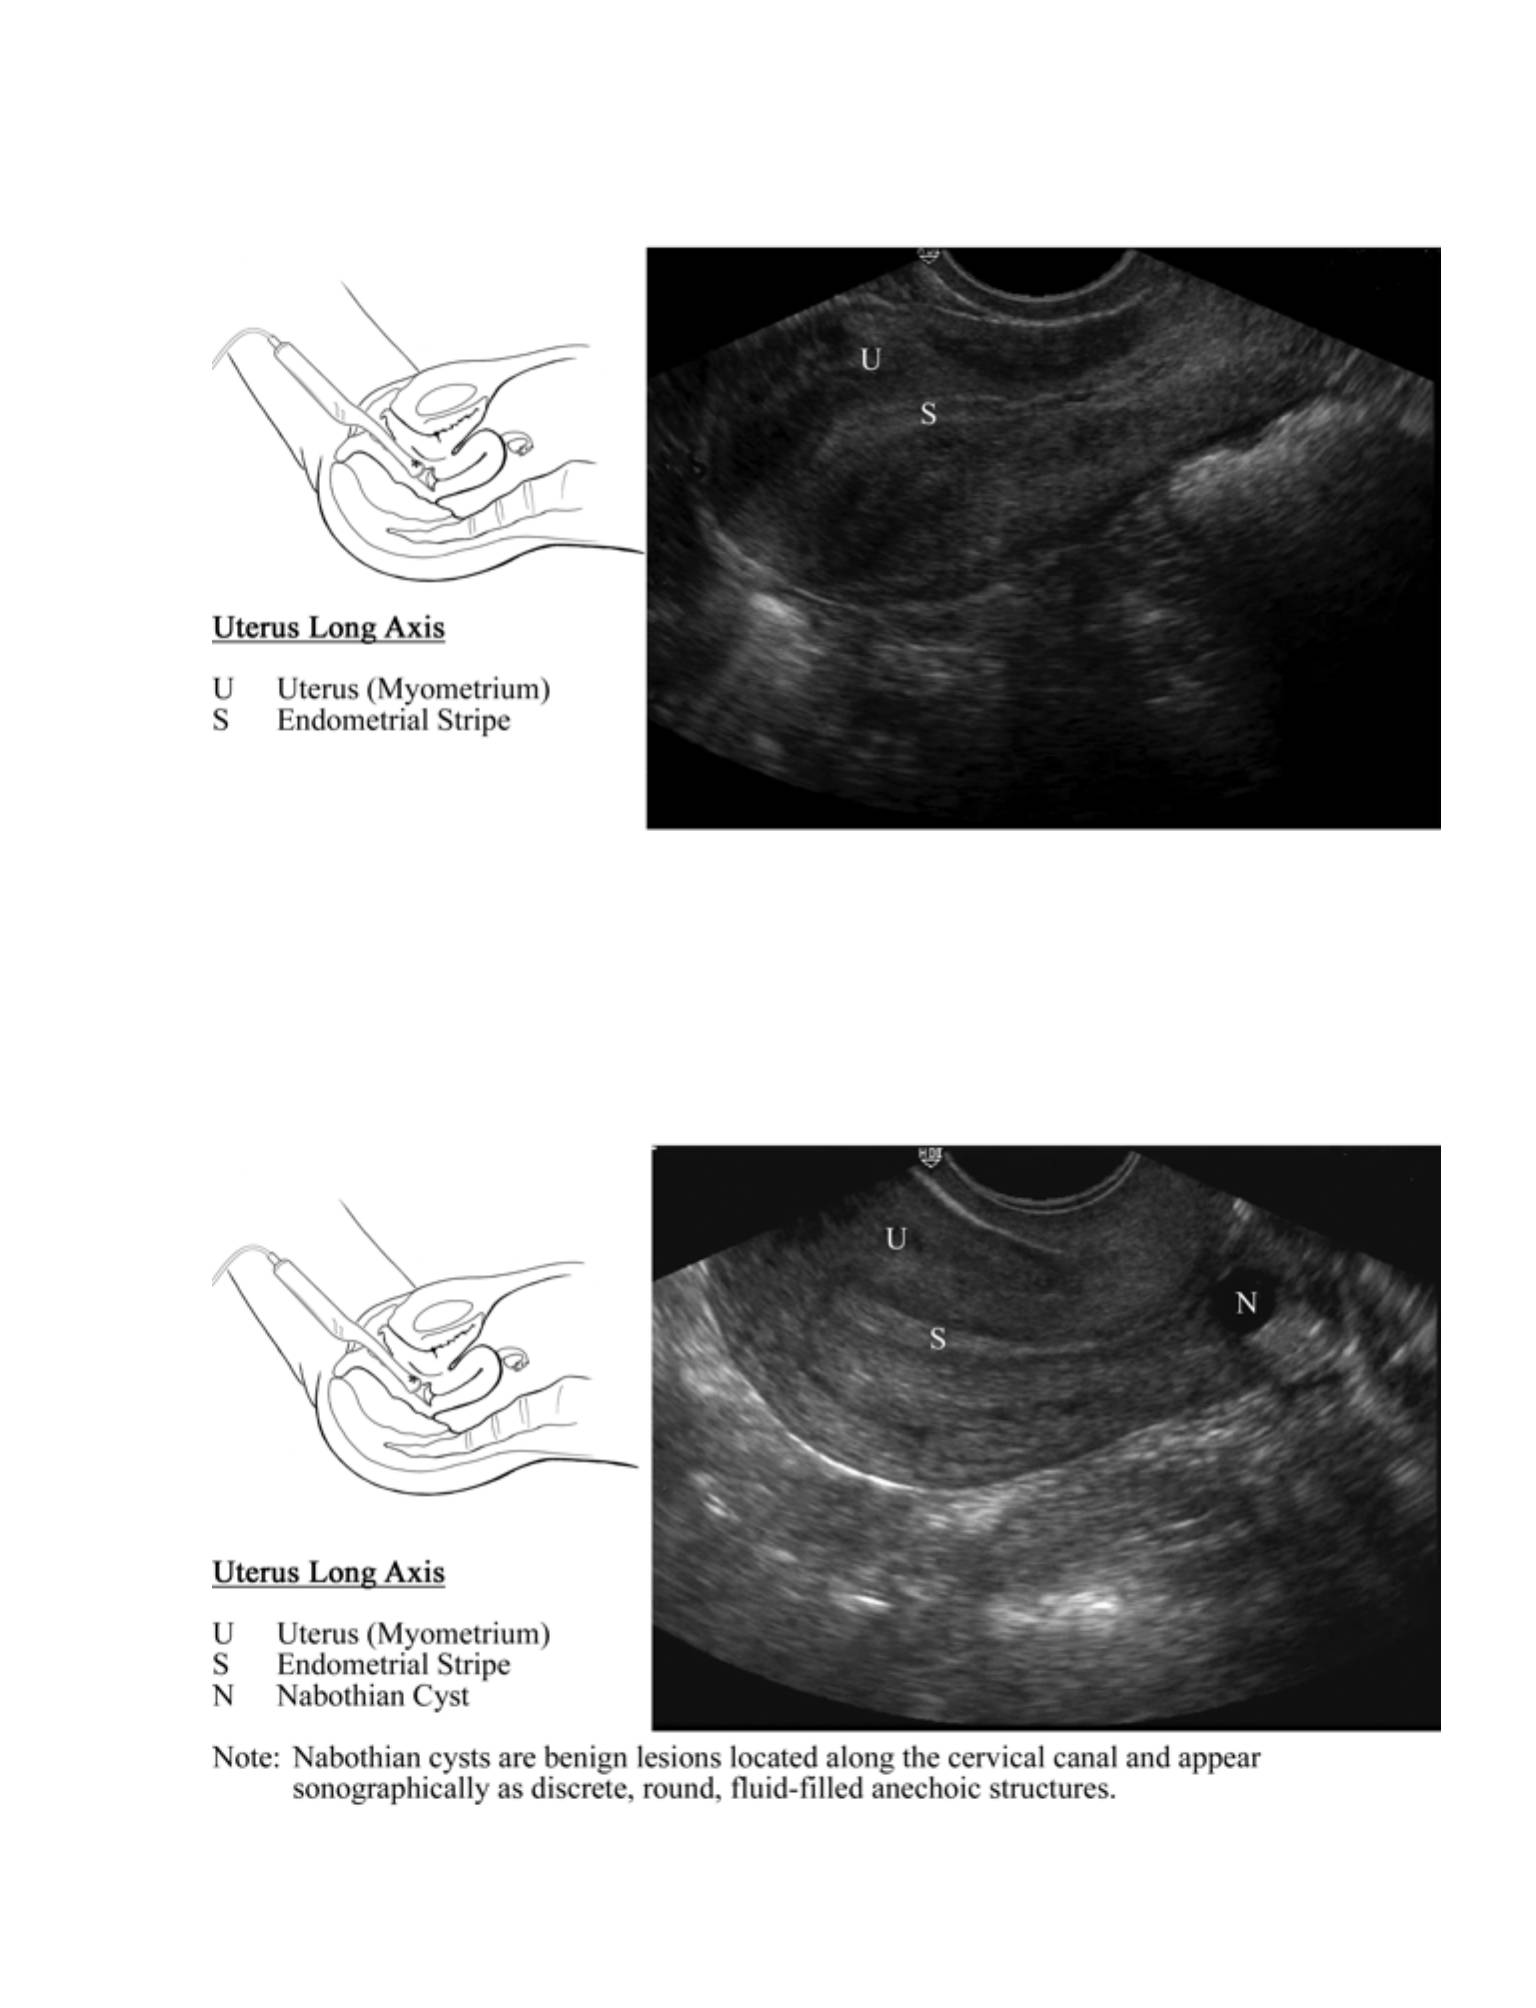
In long axis, the uterus is visualized with the endometrial stripe appearing as a
hyperechoic line in the middle of the uterus. The uterus has an echotexture similar
to the liver. The uterine stripe must be visualized and followed to the cervix to
definitively identify the uterus.
•
The following fetal structures should be located near the fundus:
•
The gestational sac appears as an oval hypoechoic fluid collection within the
uterus. A gestational sac should exhibit a decidual reaction within the
endometrium referred to as the double decidual sign, which appears as an
alternating hyperechoic/hypoechoic stripe around the gestational sac.
•
The yolk sac appears within the gestational sac and appears as a spherical,
small, thin-walled structure. Rotation of the probe is needed to confirm the
spherical nature of the yolk sac.
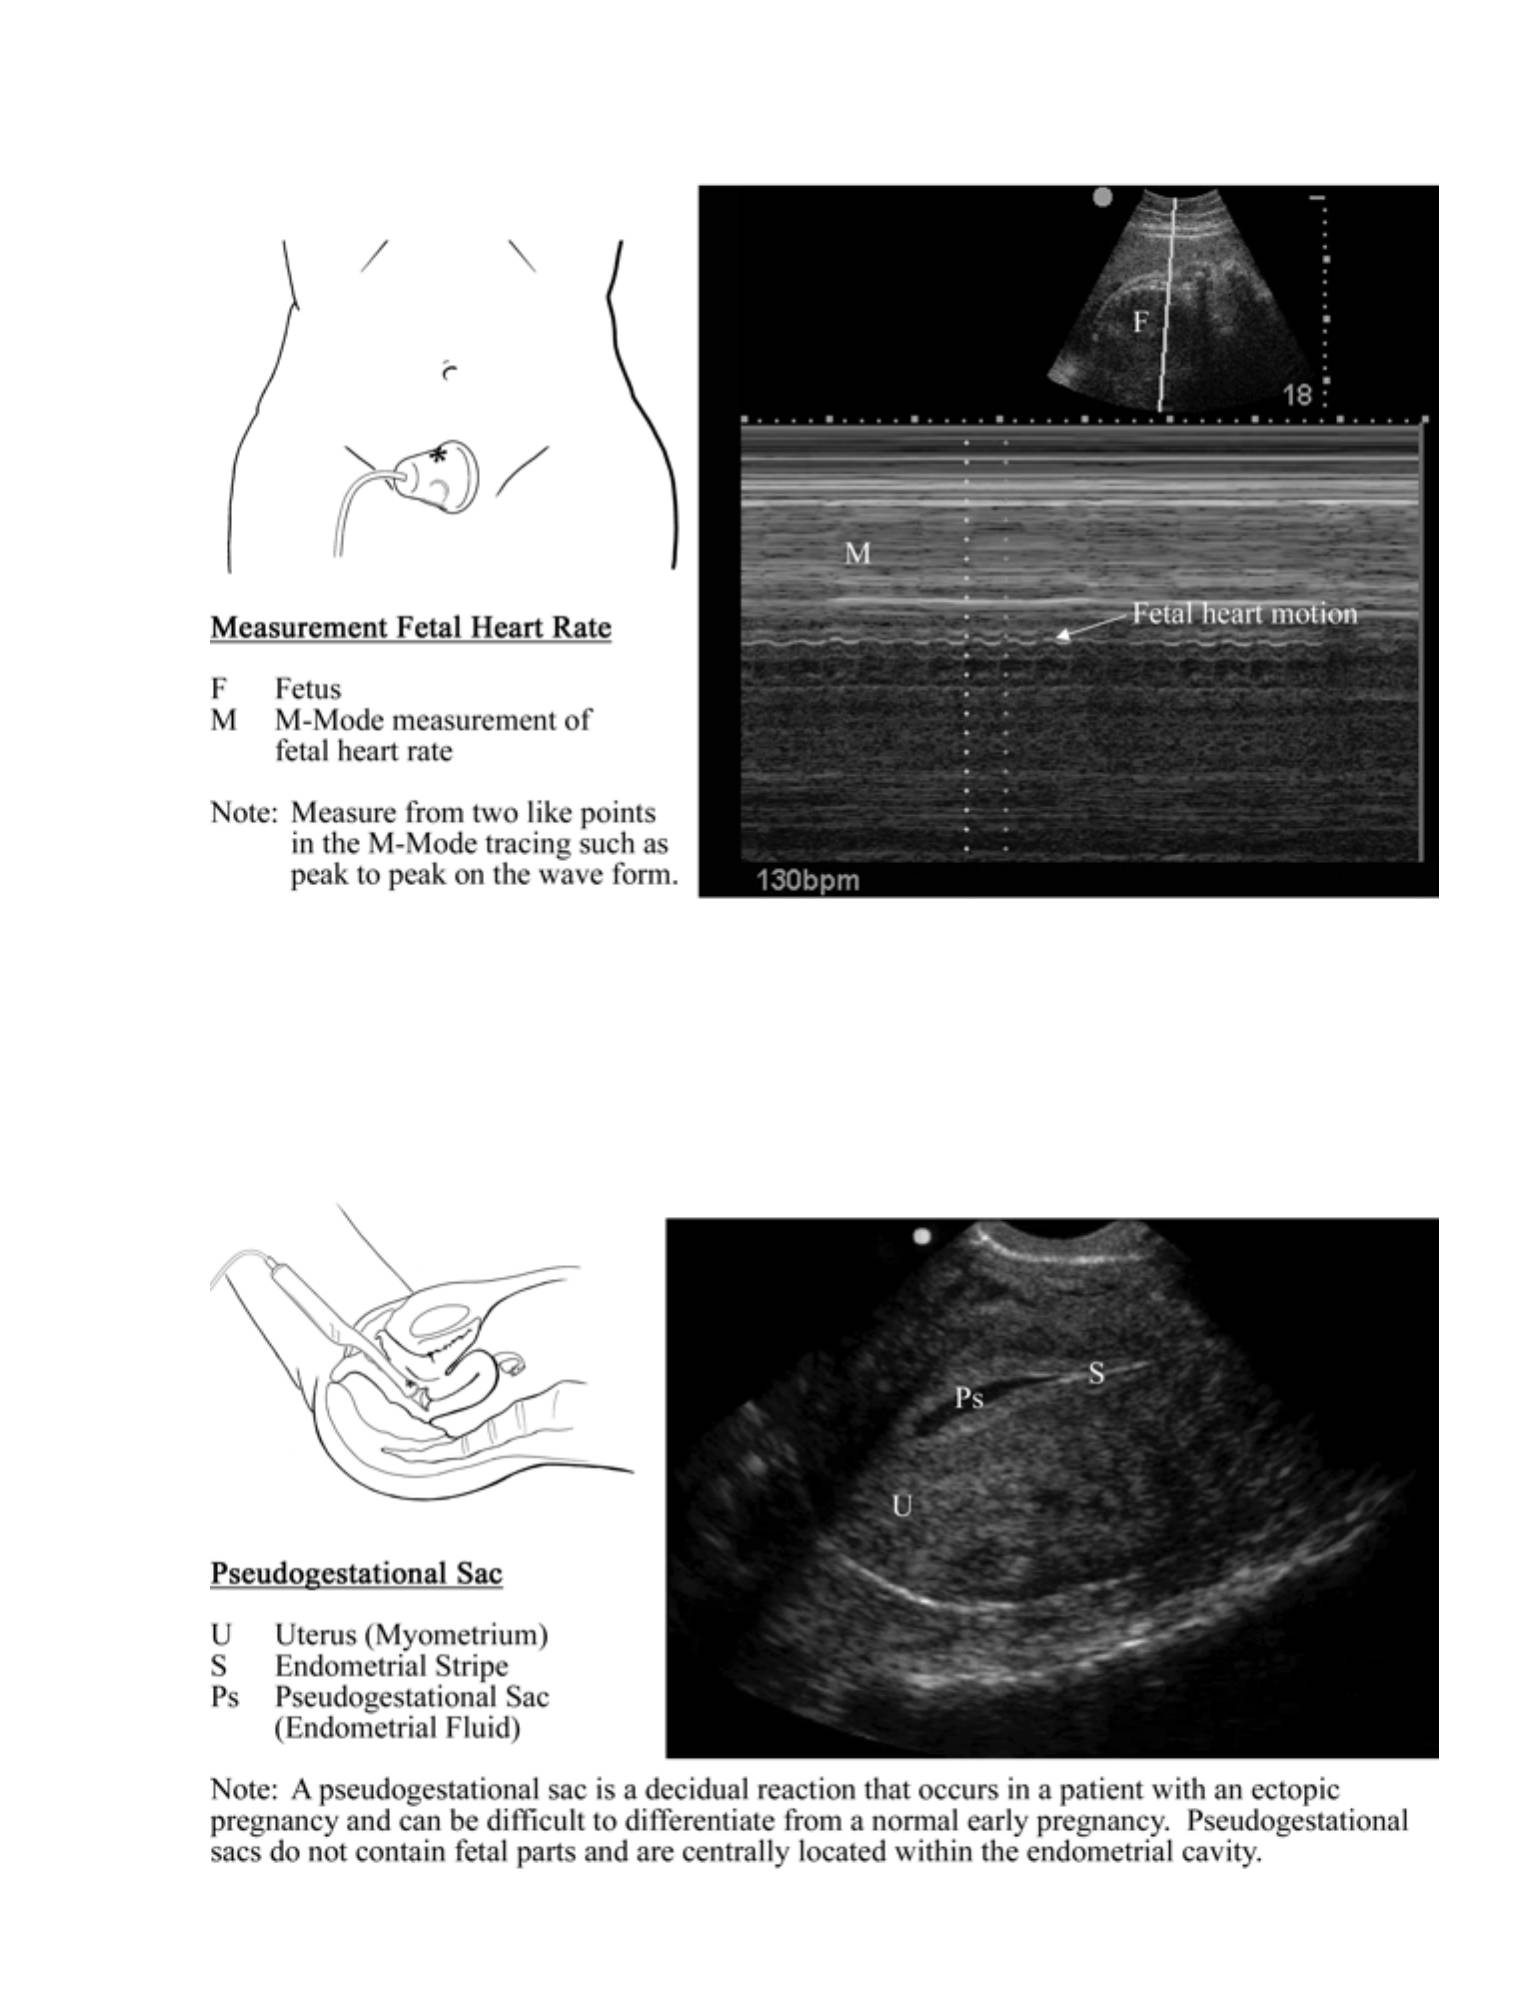
•
The fetal pole appears within the gestational sac. With small fetal poles,
distinct fetal parts may not be visualized. The fetal heartbeat is seen as
fluttering motion within the fetal pole, and the rate of the motion can be
measured using M-mode.
Pathology
•
Intrauterine Pregnancy
•
The transabdominal view is typically used to evaluate only for the presence of an
IUP.
•
If an IUP cannot be confirmed using the transabdominal view, the transvaginal
view should be used.
•
An irregular gestational sac may indicate a failing pregnancy or a
pseudogestational sac.
•
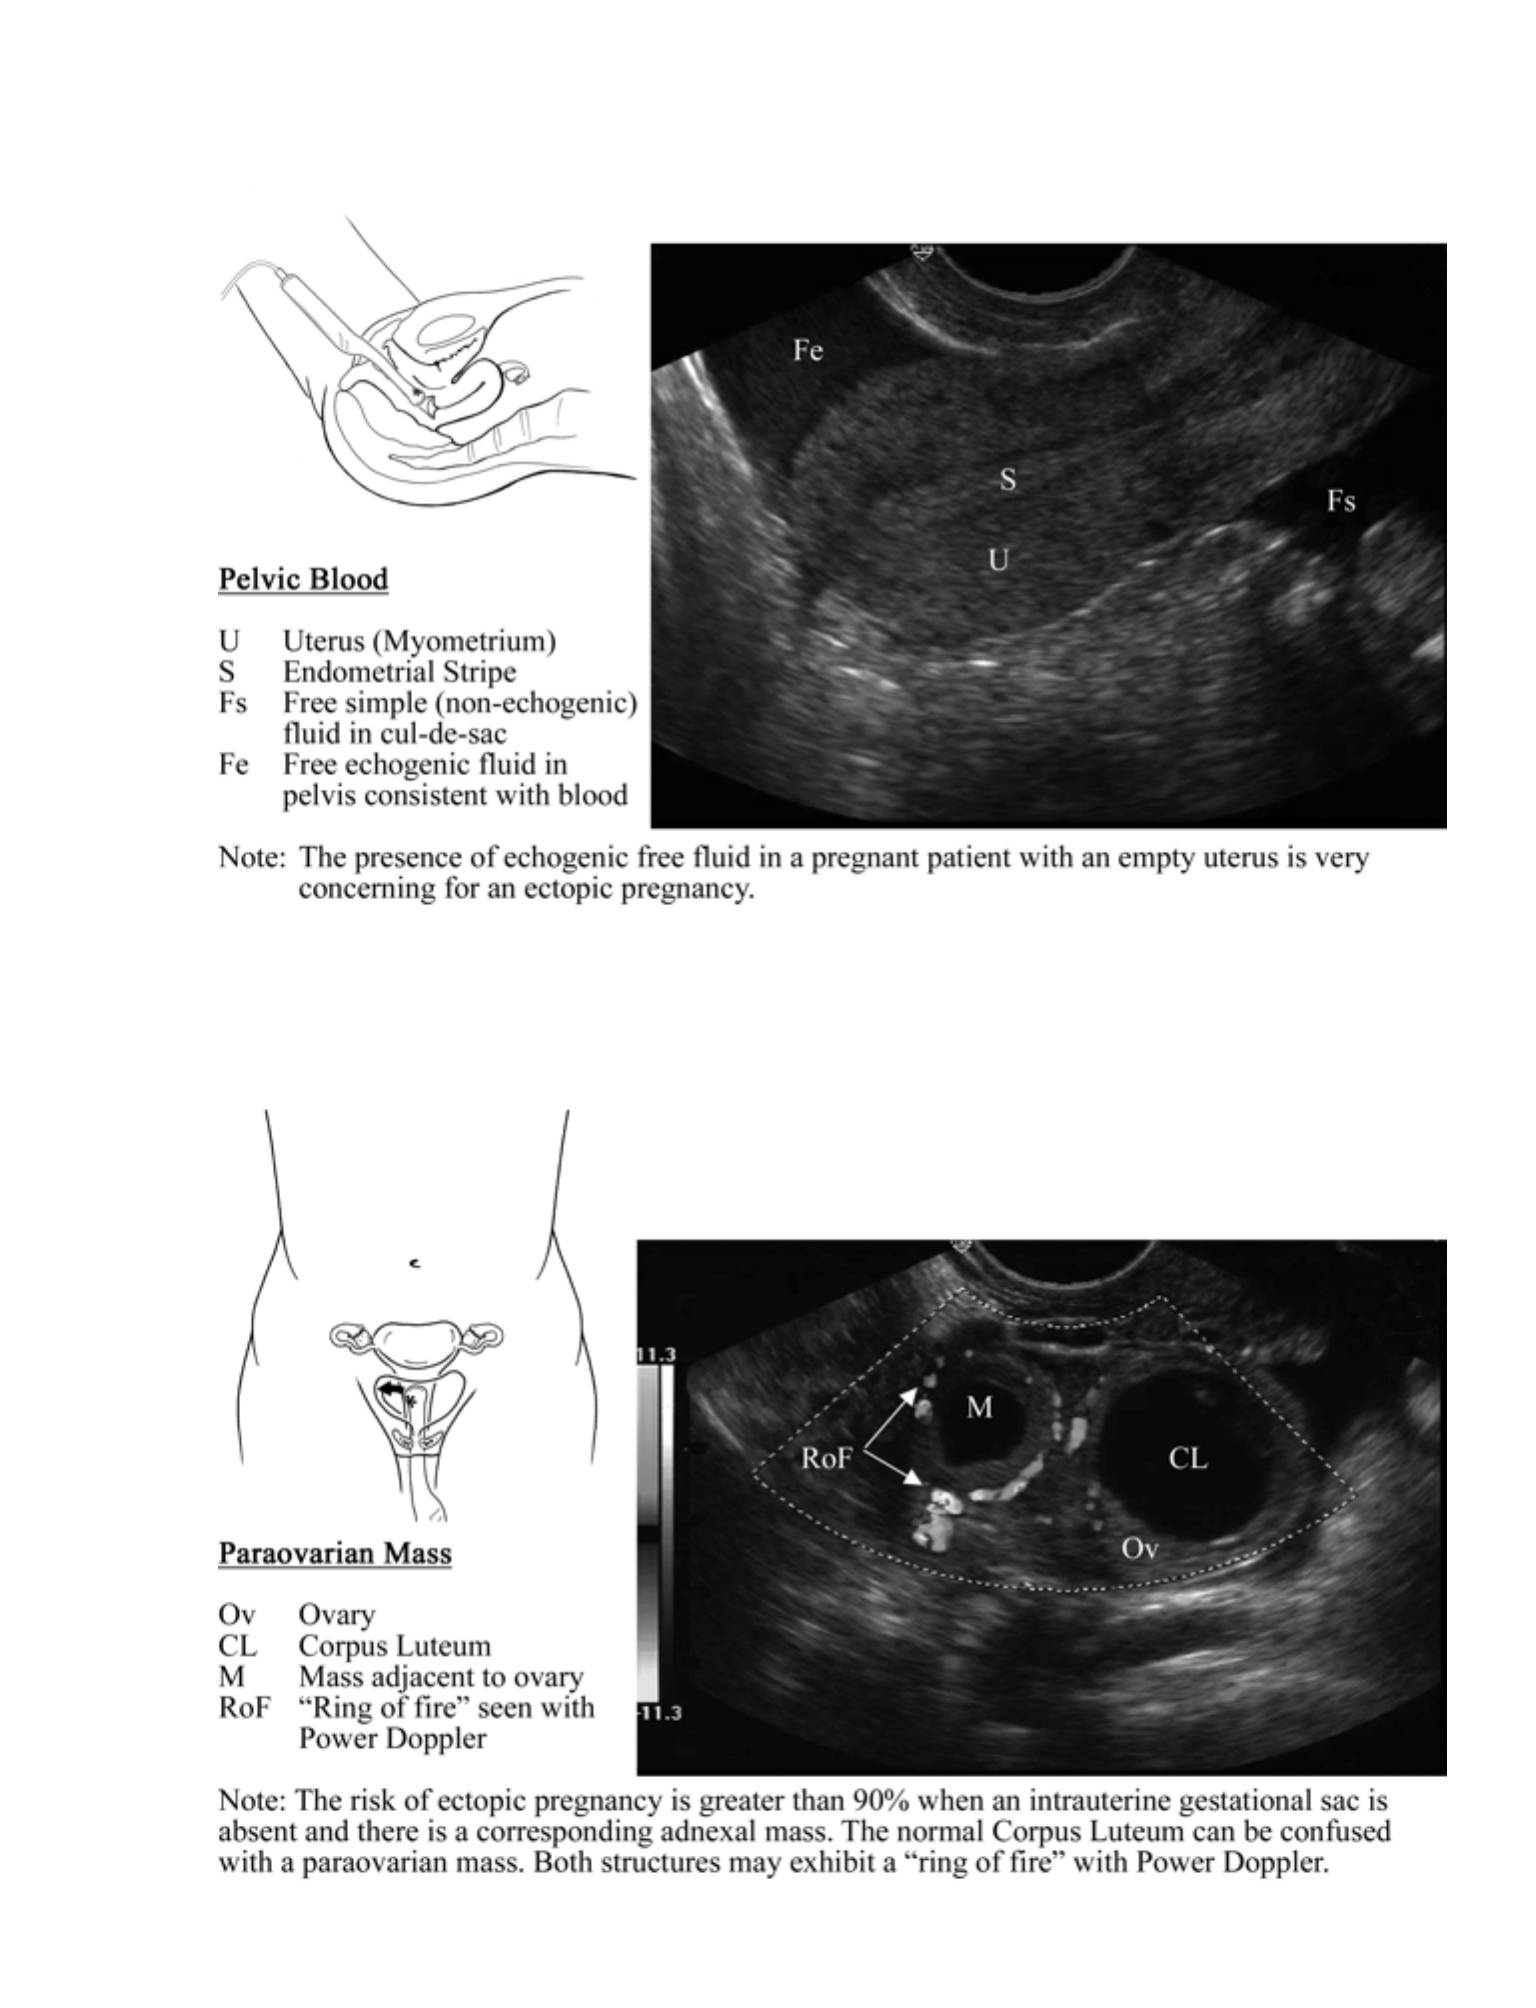
Pelvic Fluid
87

•
Fluid may be seen posterior to the uterus.
•
Anything other than small amounts of fluid is abnormal, and in the presence of
an empty uterus, an ectopic pregnancy should be suspected. A cyst may
cause intrapelvic fluid and may be serous (echo free) or sanguinous
(echogenic).
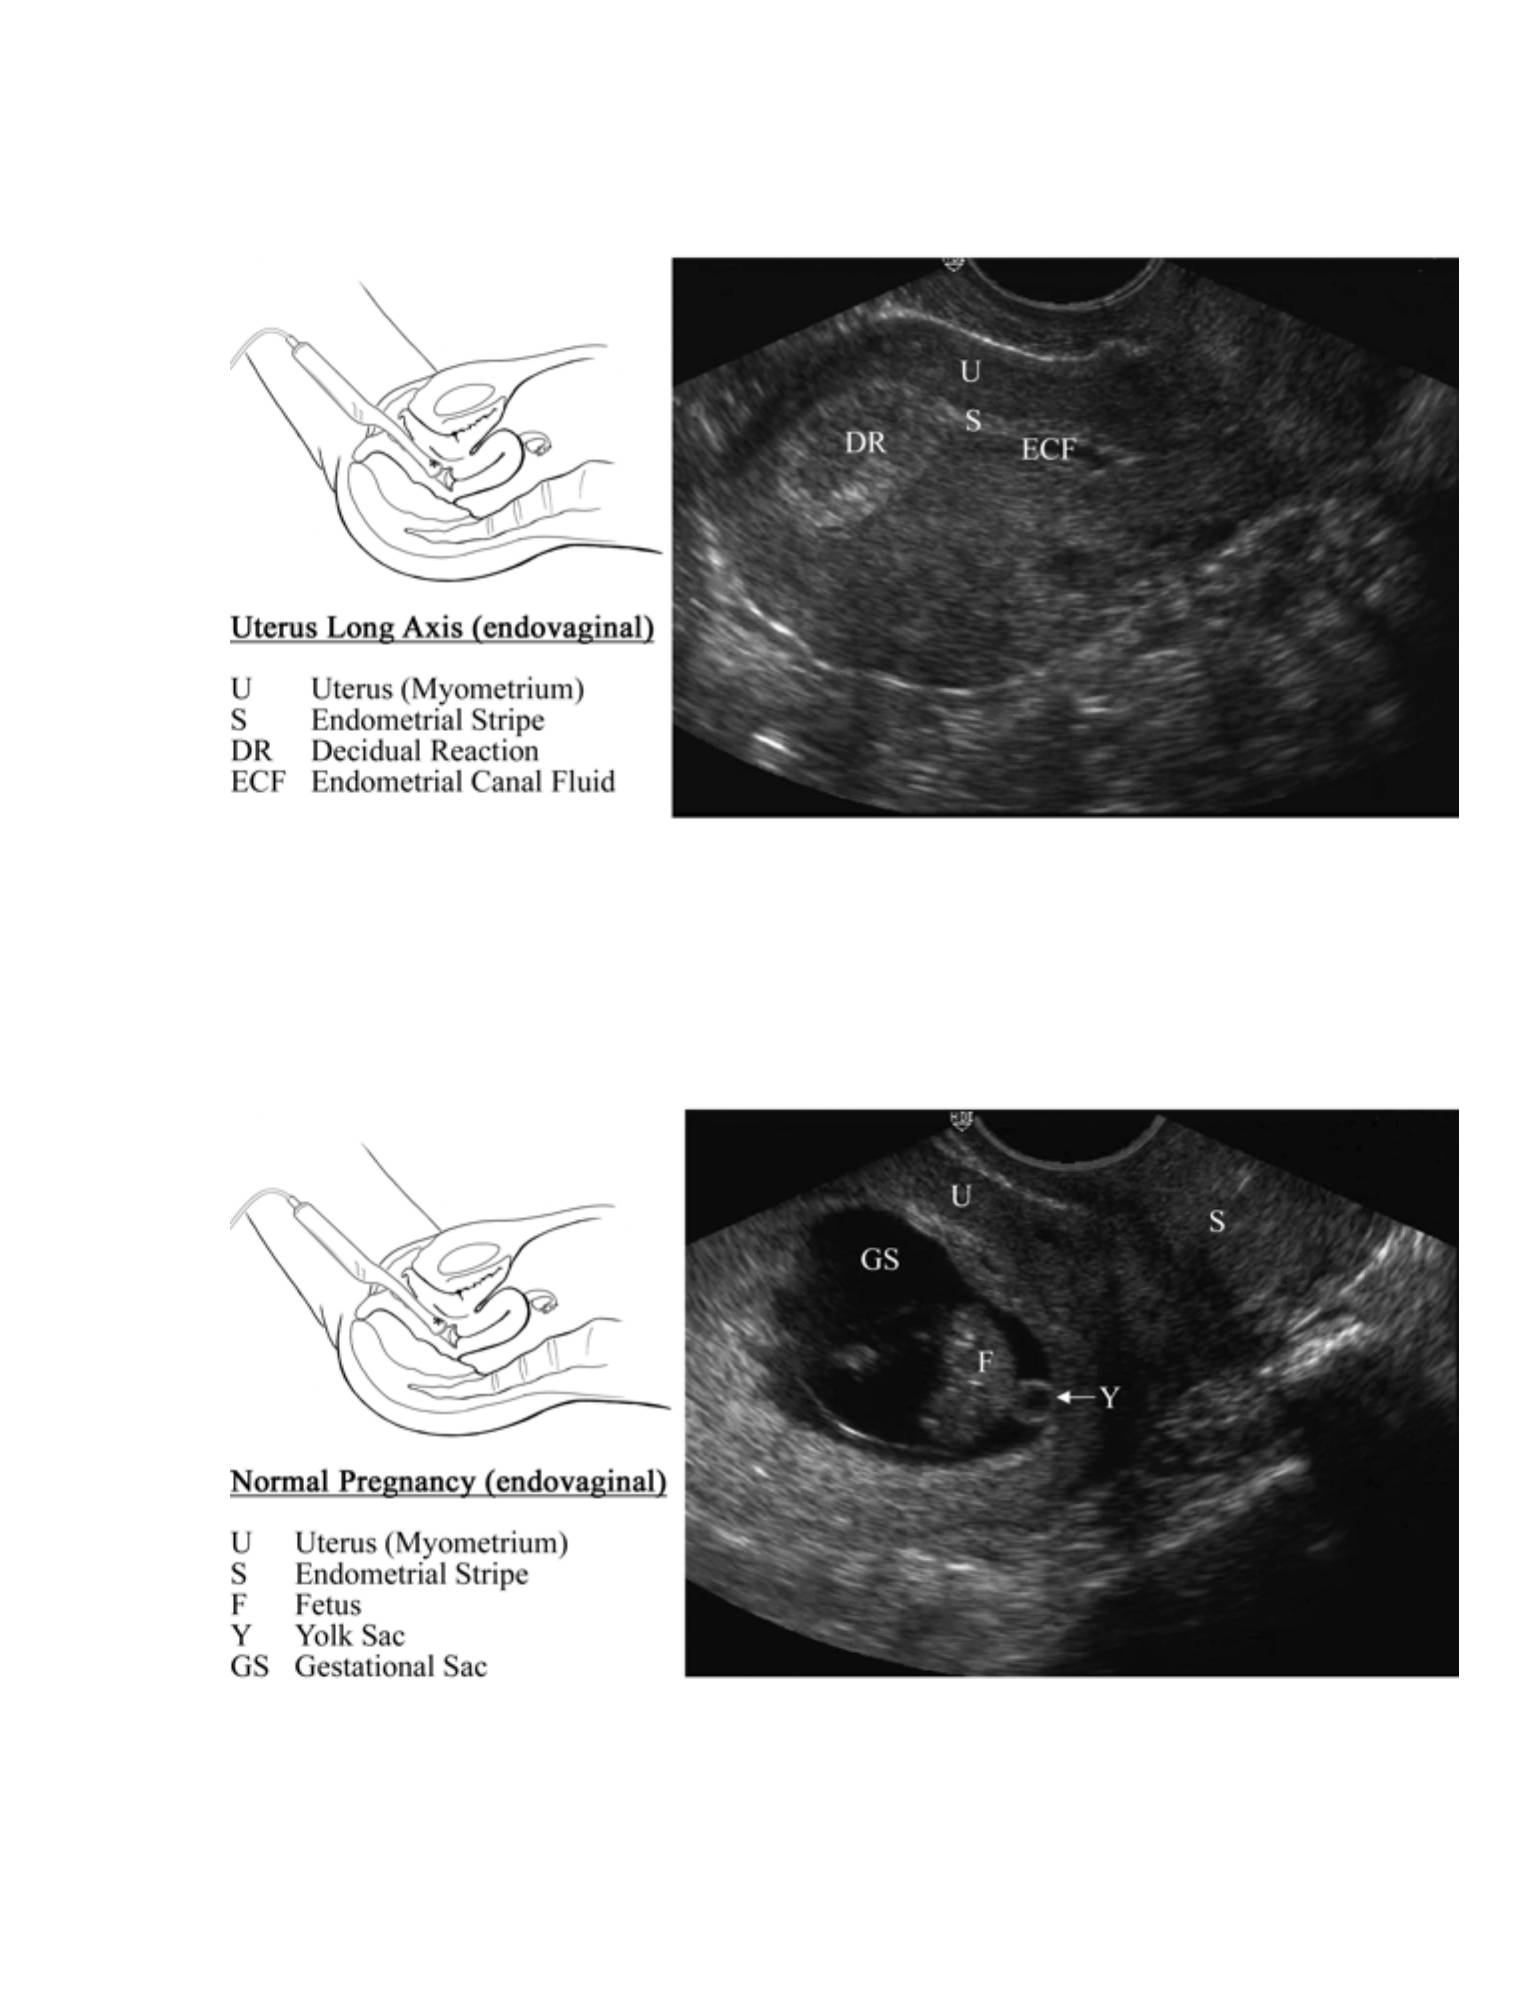
Transvaginal
Probe Placement
•
Having an empty bladder is essential. A full or partially full bladder will cause
discomfort when using the endocavitary probe. Further, urine in the bladder will
cause displacement of the uterus and ovaries, increasing the difficulty in
visualizing these structures.
•
“The probe is inserted into the vagina with the marker pointed towards the
bladder (ceiling). If the probe is correctly aligned, the bladder should be seen on
the left side of the monitor. The bladder should be seen by pointing the probe
towards the ceiling (lowering the scanning hand), and the cul-de-sac should be
seen by pointing the probe towards the floor (raising the scanning hand). The
uterus is usually in mid position and is viewed by panning the probe from side to
side.
•
The probe is rotated 90 degrees counter-clockwise towards the patient's right.
Visualization of the uterine and adnexal structures is accomplished by panning the
probe up and down. The bladder should be seen by pointing the probe towards
the ceiling (lowering the scanning hand), and the cul-de sac should be seen by
pointing the probe towards the floor (raising the scanning hand).
Anatomic Structures
•
The alignment of the uterus is variable. The uterus is typically anteflexed and
anteverted, wrapping around the superior portion of the bladder. It may, however,
be retroflexed (flexed away from the bladder) or retroverted (uterus pointing
towards the back). Further, the uterus may be twisted or angled to one side. It is
essential to identify the long axis of the uterus by identifying the endometrial
88

stripe as a hyperechoic line within the uterus. The hyperechoic line should be
seen starting near the fundus and extending to the cervix. Finding the
hyperechoic line may require that the probe be angled to one side and/or rotated
slightly. The long axis of the uterus is seldom lined up exactly with the long axis of
the body.
•
The appearances of the fetal structures are the same for the transvaginal and
transabdominal views.
•
With the transvaginal view, smaller structures can be seen with greater detail (and
can usually be seen about one week prior to being seen transabdominally).
•
“The ovaries can be found by angling the probe to the left or right (for the left or
right ovary respectively) while in cross section (the indicator pointed to the
patient's right). To find the ovaries, keep the uterus to one side of the screen, and
pan up and down each side of it. Typically the ovaries (hyperechoic structures
with hypoechoic follicles) are located lateral to the uterus and medial and anterior
to the iliac vessels (hypoechoic tubular structures).
•
The corpus luteum is a normal pregnancy structure located within one of the
ovaries. It may appear as hyperechoic, hypoechoic, or isoechoic and either solid,
cystic, or both solid and cystic. When using Power Doppler, the corpus luteum will
demonstrate blood flow at the periphery described as a "ring of fire". The "ring of
fire" can also be seen with an ectopic pregnancy.
Pathology
•
Intrauterine Pregnancy
•
Gestational sac
•
Sonolucent fluid collection surrounded by a thick symmetric echogenic
ring within the uterus. Can be confused with a pseudogestational sac.
•
The presence of a yolk sac or fetal pole within the uterus is diagnostic for an
intrauterine pregnancy.
89

•
The presence of fetal cardiac activity within the uterus is diagnostic for a live
intrauterine pregnancy. fluid and gas within the mass
•
Interstitial Ectopic Pregnancy
•
Implantation in the highly vascular region of the uterus near the insertion of
the fallopian tube
•
Approximately 2 - 4% of all ectopic pregnancies
•
Findings that suggest an interstitial ectopic pregnancy:
•
Eccentric location of the gestational sac high in the fundus
•
Less than 5 mm of myometrium surrounding the gestational sac
•
Presence of an interstitial line sign - a thin echogenic line extending from
the edge of the endometrial canal into the middle of the interstitial mass
•
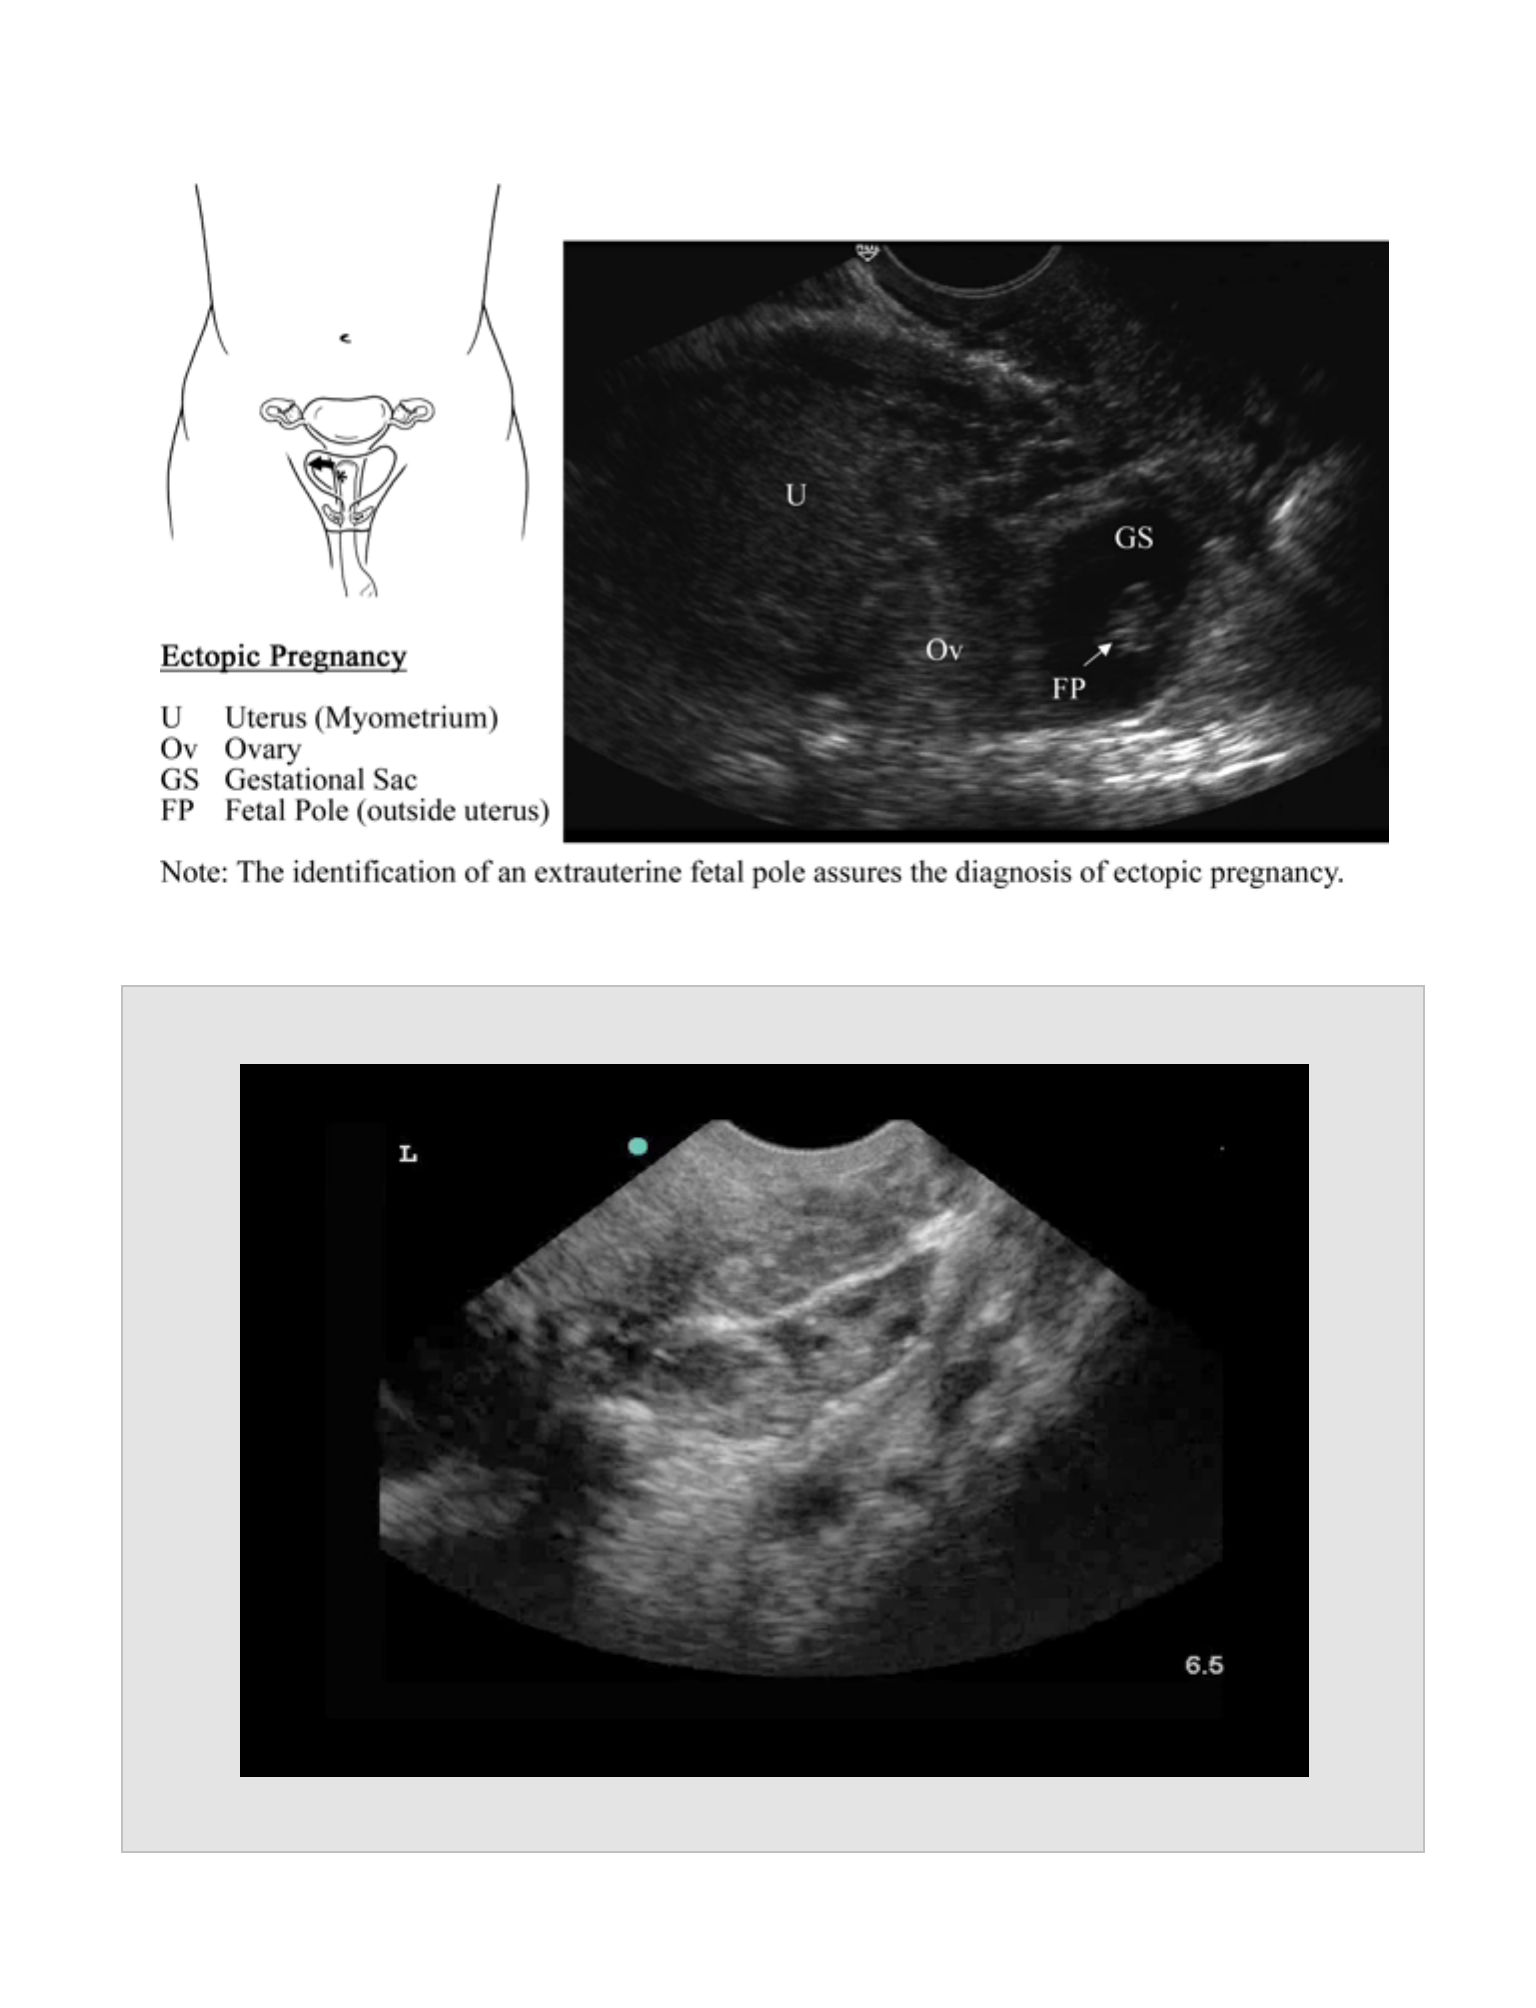
Ectopic Pregnancy
•
Extrauterine pregnancy
•
Should be suspected in any pregnant patient presenting with abdominal pain
or vaginal bleeding and a sonographically empty uterus.
•
Likelihood of ectopic pregnancy can be estimated using the presence of:
•
Pseudogestational sac
•
A decidual reaction and endometrial fluid
•
Does not contain fetal parts and is centrally located within the
endometrial cavity
•
Can be difficult to distinguish from a normal gestational sac
90

•
Pelvic fluid
•
The greater the amount of pelvic fluid, the greater the likelihood of an
ectopic pregnancy.
•
A small amount of fluid is normal. As the amount of fluid increases, it
can be seen spreading from just posterior to the cervix (small) to
posterior to the uterus (moderate) to above the fundus or around the
ovaries (large).
•
The type of fluid can be an important factor for determining the risk of an
ectopic pregnancy.
•
Simple, echo-free fluid
•
Risk for the presence of ectopic pregnancy depends on the
amount present.
•
Echogenic fluid (represents blood)
•
Represents a high risk for the possibility of an ectopic pregnancy
•
Hyperechoic masses floating within the echogenic fluid indicate
clotted blood.
•
Tubal ring sign
•
A concentric hyperechoic structure found in the adnexa
•
Adnexal masses
•
Structures that are separate from the ovary or the uterus
•
Highly suspicious for an ectopic pregnancy
•
Often appear as spherical structures, but other shapes may be encountered
91

•
Frequently demonstrate increased blood flow using Power Doppler,
resembling the "ring of fire" seen with a normal corpus luteum
•
Adjacent to the ovary; can be difficult to distinguish from a normal corpus
luteum. Because intra-ovarian ectopics are very rare (< 1% of ectopics),
applying pressure with the probe should be able to separate an ectopic mass
from the ovary.
•
Fetal demise can be predicted by the following:
•
A gestational sac that is distorted or irregular in shape is likely abnormal.
•
A gestational sac > 10 mm without a yolk sac is likely abnormal.
•
A gestational sac > 18 mm without a fetal pole is likely abnormal.
•
A fetal pole without cardiac activity after 7 weeks gestational age or crown-
rump length > 6 mm is likely abnormal.
•
Blighted Ovum
•
An empty gestational sac > 20 mm in diameter
Normal Measurements
•
Gestational sac: 1 – 2 mm @ 4 weeks; 2 – 4 mm @ 32-35 days;
•
5 mm @ 36-37 days menstrual age
•
Yolk sac: 3–7 mm; usually present until 12 weeks gestation
92
Menstral Age (Weeks)
CLR (mm)
US Landmark
3-4
Decidual Reaction
4(+/- 2 Days)
Gestational Sac;Double Decidual
Sign
5
1-2
Yolk Sac; Embryonic Pole
5-6
5-6
Cardiac Activity

Reports
•
Long and short axis through the uterus with demonstration of the endometrial
stripe
•
Gestational sac, yolk sac, fetal pole, or fetal heart rate, as applicable
•
Both ovaries in long and short axis
•
Any adnexal masses
•
Any free pelvic fluid
Pearls
•
Transvaginal US orientation can be confusing. Think of the probe as a flashlight,
and point the probe in the direction in which you are interested. If you become
lost, return to the longitudinal uterus view to reorient yourself.
•
The risk of ectopic with an intrauterine pregnancy (heterotopic) is 1/30,000. The
risk is increased in women undergoing fertility treatments to 1/5,000 or greater.
•
Ectopic pregnancies can have any βhCG level. No level rules out an ectopic
pregnancy.
•
Expected βhCG levels in which an IUP should be seen are as follows:
•
βhCG discriminatory zone 1250-1500 for Transvaginal US
•
βhCG discriminatory zone 5000-6000 for Transabdominal US
•
An empty uterus and a βhCG greater than the discriminatory zone may be
seen with:
•
Ectopic pregnancy
•
Spontaneous miscarriage
93

•
Twin pregnancy
•
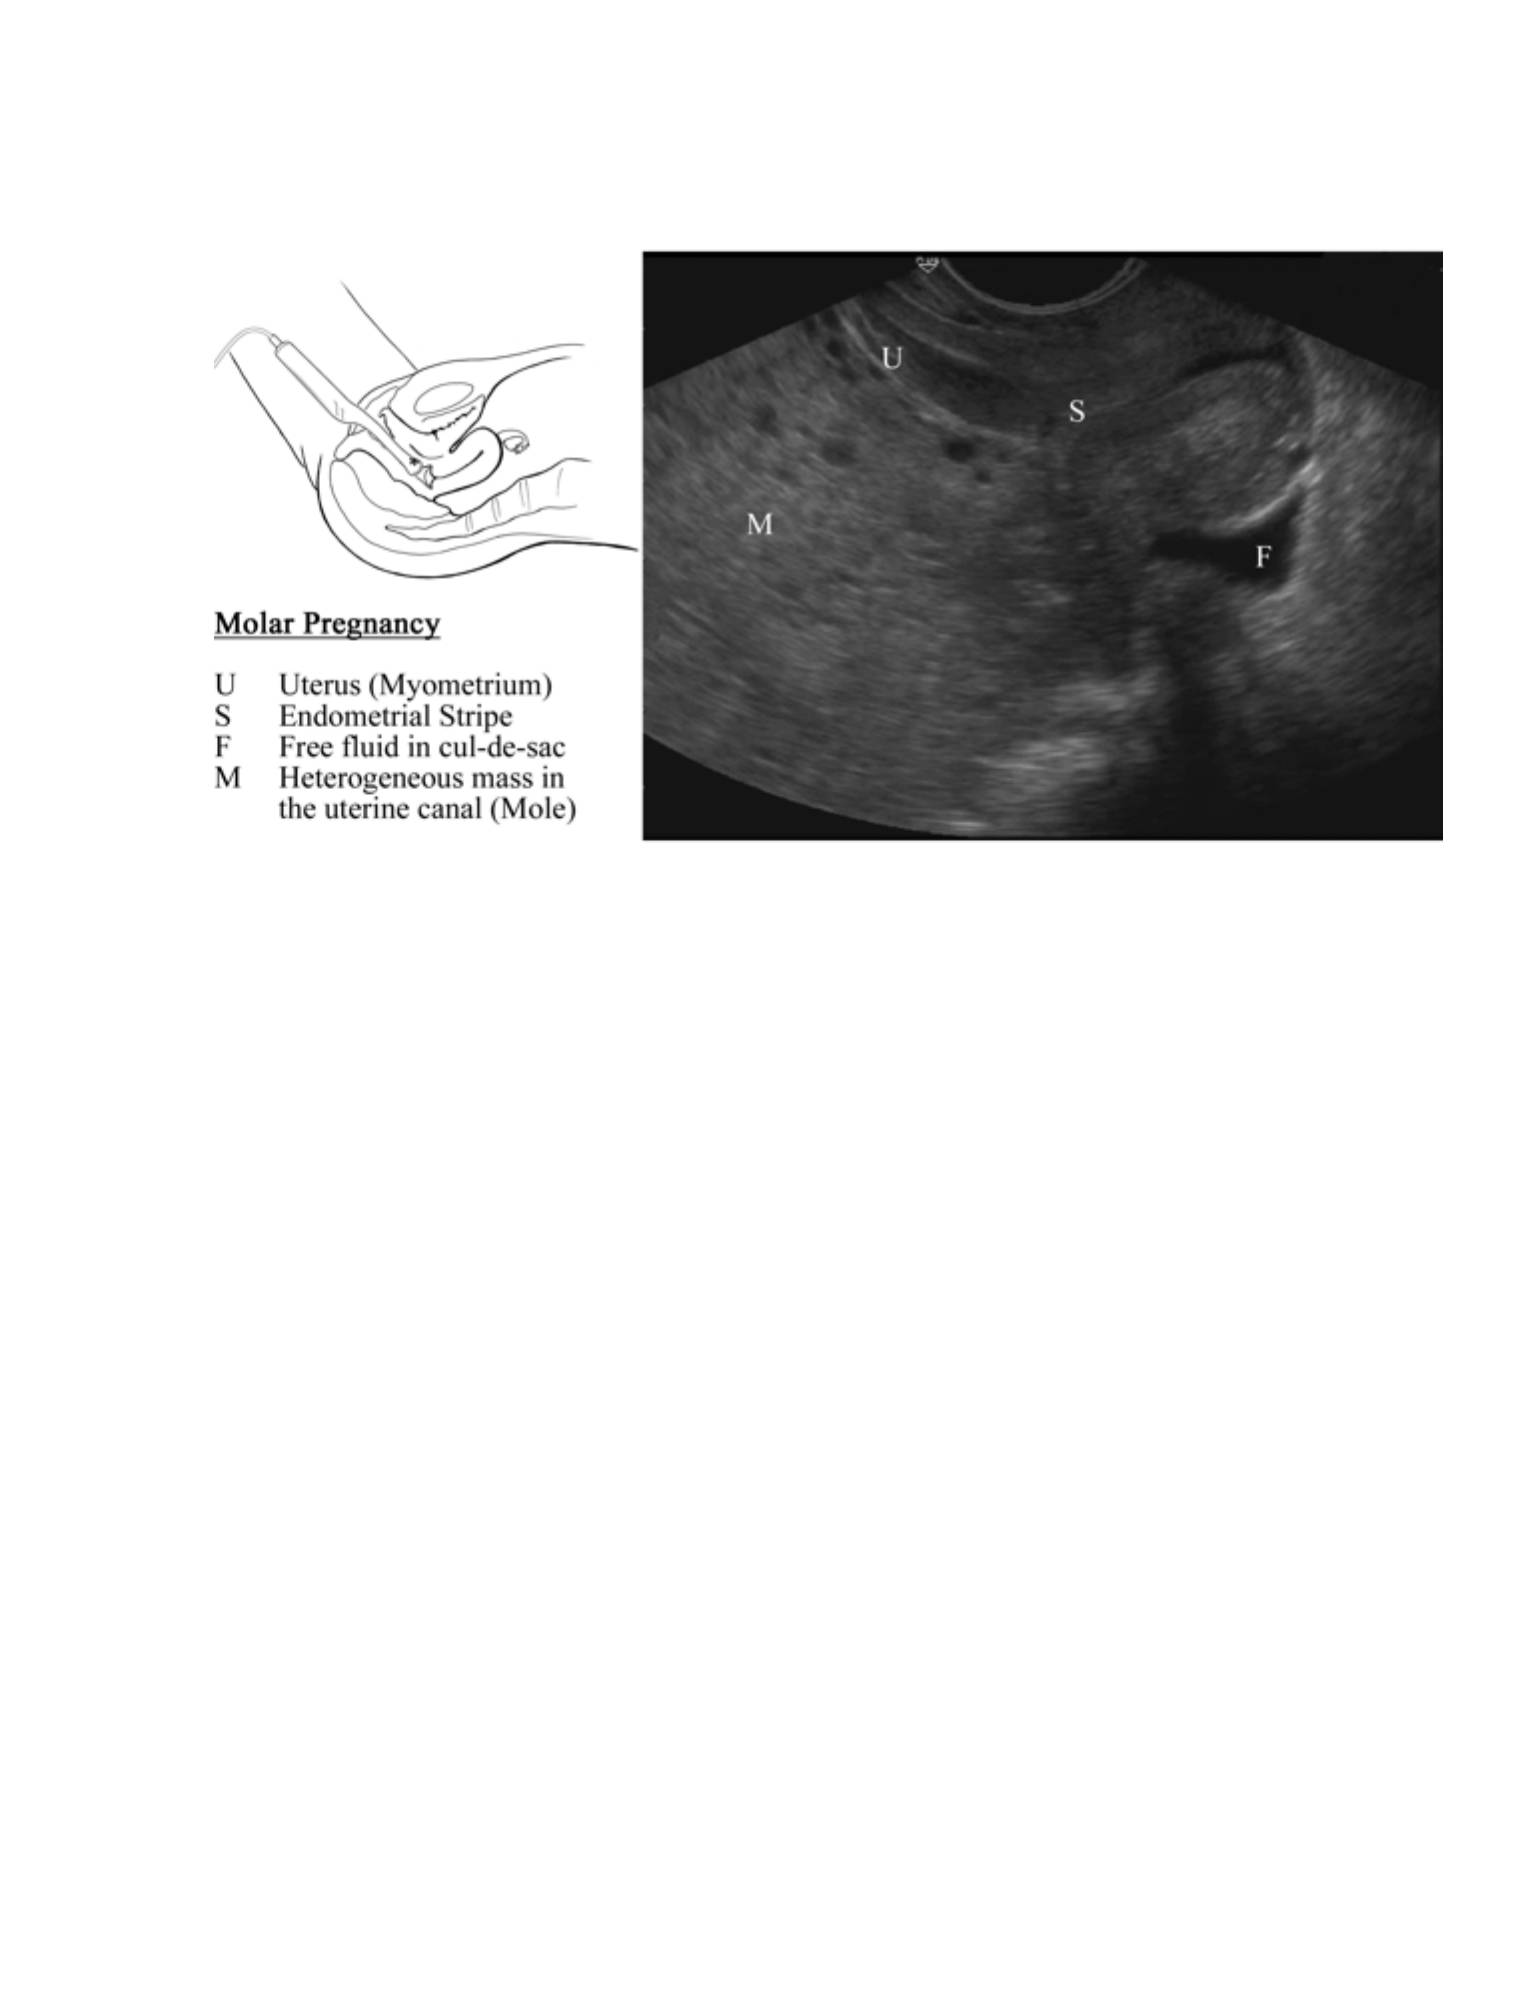
Molar pregnancy
•
Normal pregnancy
•
The presence of a yolk sac or fetal pole within the uterus is diagnostic for an
intrauterine pregnancy.
•
The presence of fetal cardiac activity within the uterus is diagnostic for a live
intrauterine pregnancy.
Pitfalls
•
Dates from LMP are often inaccurate and should not be used to rule out the
possibility of an ectopic pregnancy.
•
Changes in the βhCG level are useful in evaluating a pregnancy.
•
The βhCG level in a normal pregnancy typically doubles every
•
48 hours, whereas those in abnormal pregnancies may not. Even though most
ectopic pregnancies exhibit falling or inappropriately rising βhCG levels, normal
doubling of levels can be seen.
•
The presence of only a double decidual sign should not be relied upon to define
an intrauterine pregnancy.
•
A pseudogestational sac (fluid between the endometrial linings) may be confused
with a true gestational sac.
•
Care must be used in diagnosing fetal demise. Criteria for diagnosing fetal demise
are not absolute, and patients should be referred to obstetric follow-up for this
diagnosis.
94
Clinical Integration Diagram
95
OB Ultrasound
Immediate
OB consult
Consider OB consult
vs. further evaluation
Signs of Ectopic
No IUP
OB follow up
or consult
Definite IUP
96
Normal Pregnancy (Transabdominal US)
Movie 9.1
97
98
99
99
100
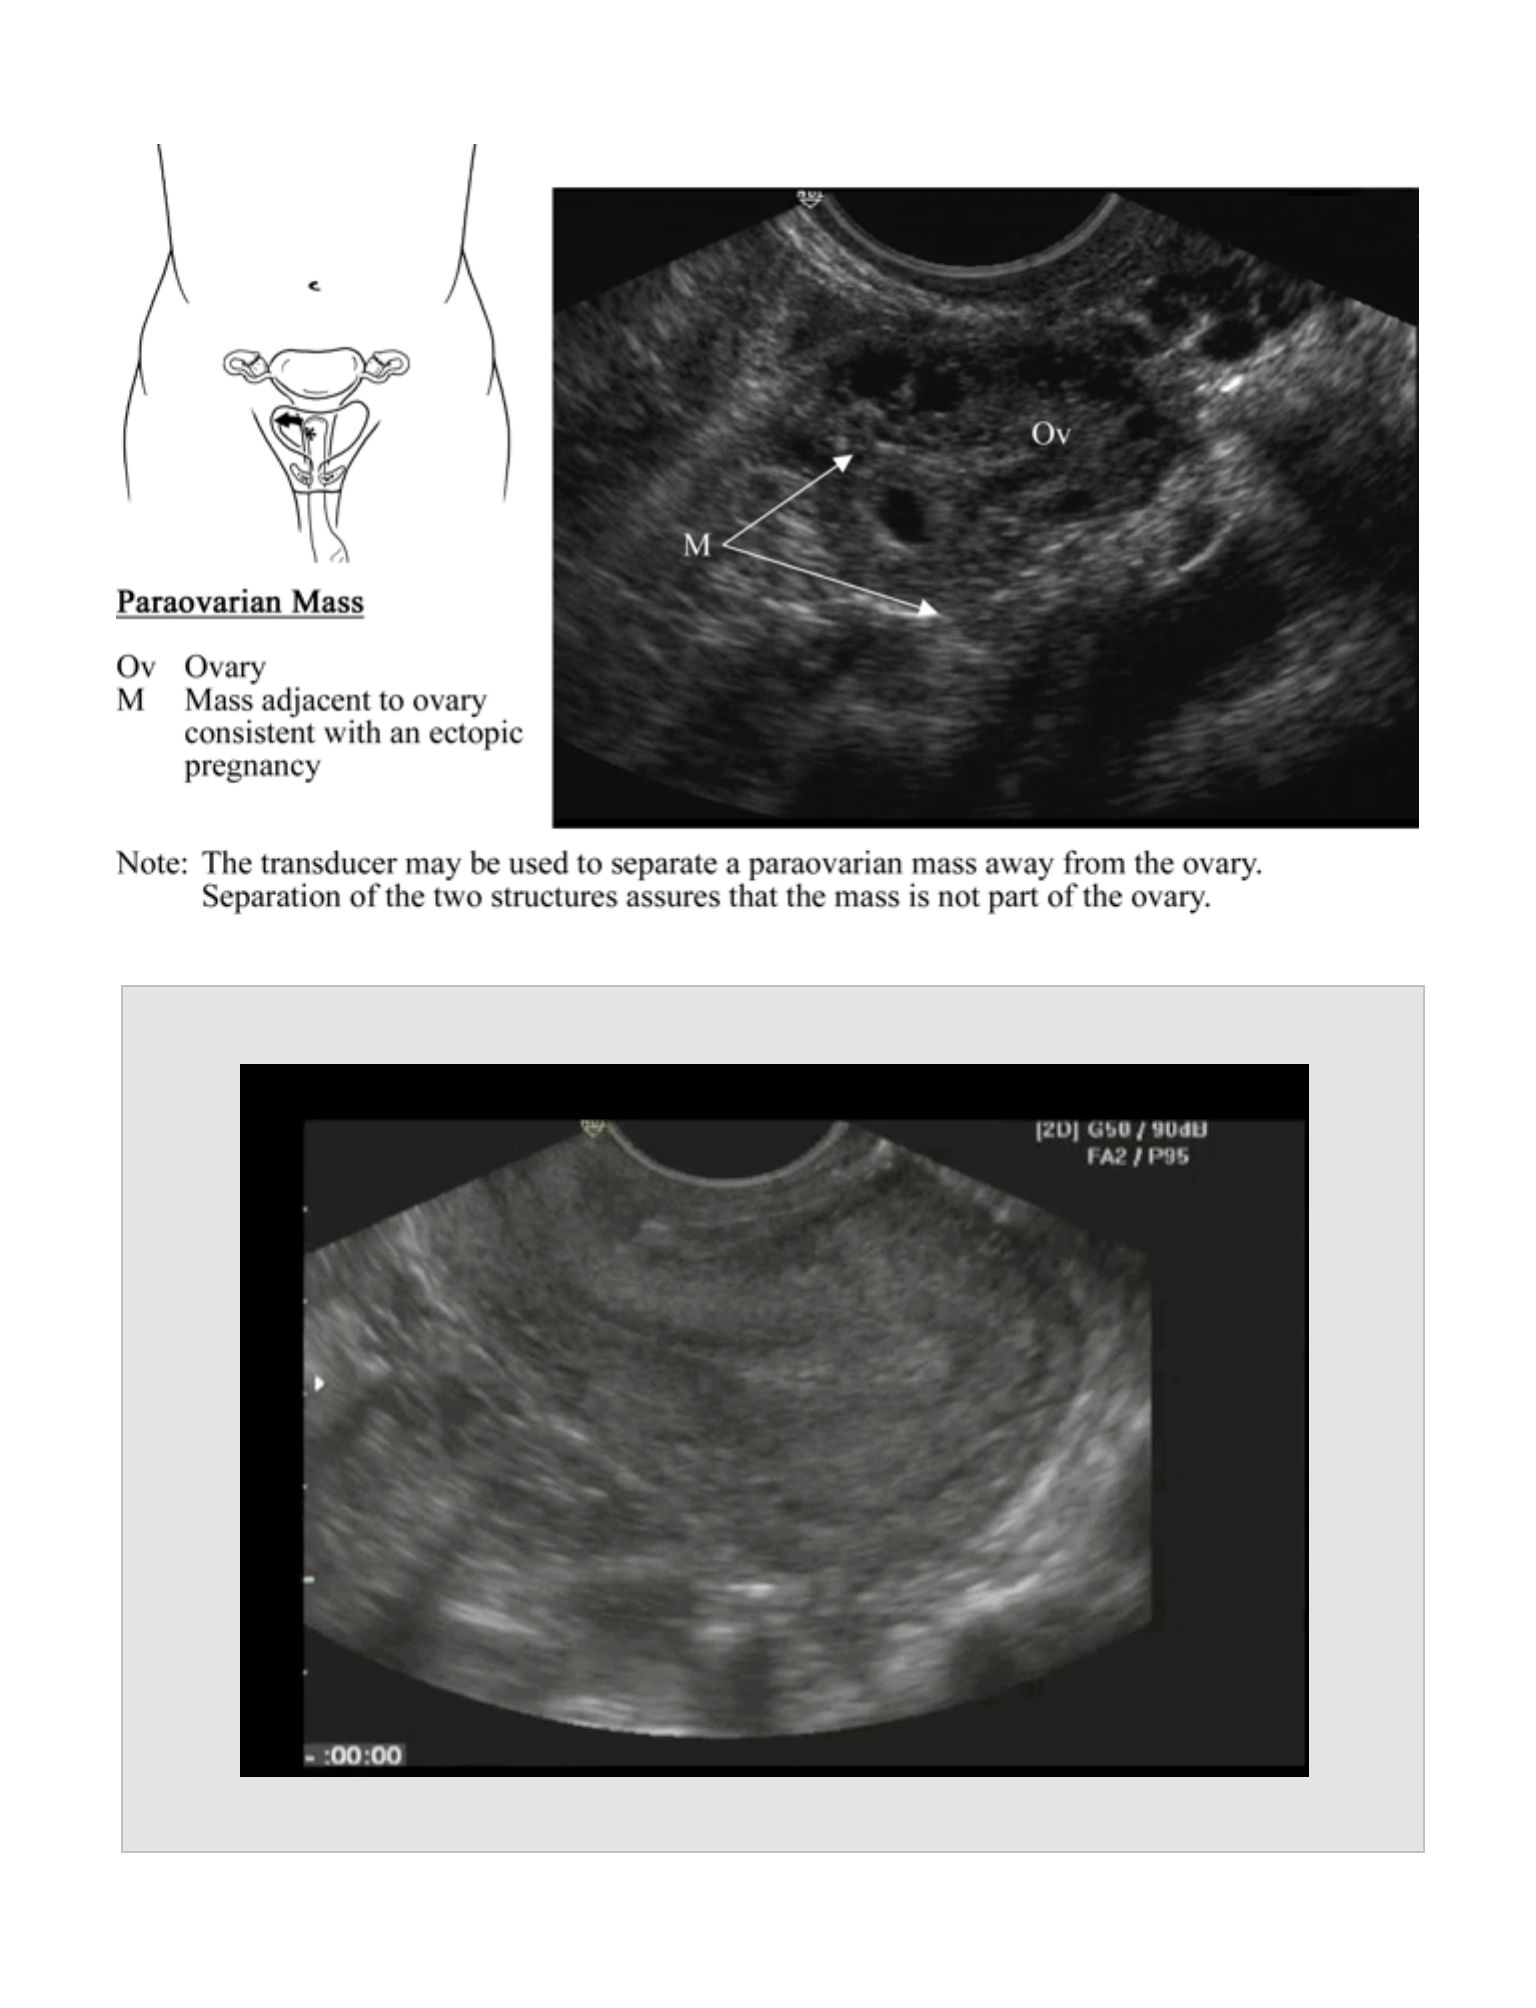
Paraovarian Ectopic Pregnancy
Movie 9.2
101
Ectopic Mass with Separation from Ovary
Movie 9.3
102
Evaluation for Deep Venous Thrombosis

EVALUATION FOR
DEEP VENOUS
THROMBOSIS
CHAPTER 10
103

104
Indications
Lower extremity pain or swelling suggestive of a deep venous thrombosis (DVT)
Goals
To visualize compression of the common femoral vein, proximal saphenous vein,
proximal portion of the deep and superficial femoral vein, and the popliteal vein
Probe
Linear array vascular probe (4-8 MHz)
Patient Position
The patient should be supine with the head of the bed elevated to enhance the
distention of the lower extremity veins.
Standard Views and Probe Position
Lower extremity venous ultrasound
Probe Placement
•
Begin just inferior to the inguinal crease on the anteromedial thigh with the probe
perpendicular to the thigh and the indicator to the right.
•
Identify the veins (confirm using Doppler if necessary), and then compress them
by applying pressure with the probe. The probe should compress the vein
perpendicularly, avoiding sliding up or down the vein with compression.
•
Observe the complete collapse of the femoral vein proximal to the entry of the
saphenous vein through the bifurcation into the deep and superficial femoral veins
distally. Compression should occur at least every 1-2 cm or every width of the
transducer.
•
Once the upper leg veins are visualized and compressed, the process is repeated
with the popliteal veins. When examining the popliteal region, flex the knee slightly
to allow the probe to fit into the popliteal fossa.
•
Observe the complete collapse of the popliteal vein from a single vessel
proximally to its trifurcation distally.
EVALUATION FOR DEEP
VENOUS THROMBOSIS

•
Compression is always performed in a transverse orientation, as compression in
long axis is not reliable.
Anatomic Structures
•
The common femoral vein (CFV) is found just below the inguinal ligament.
Branches of the CFV include the saphenous vein, superficial femoral vein (SFV),
and deep femoral vein (DFV). Compression should occur from above the
sapheno-femoral junction through the bifurcation of the CFV into the deep and
superficial femoral veins.
•
The popliteal vein should be visualized and compressed starting in the proximal
popliteal fossa through to its trifurcation in the proximal calf.
Pathology
•
DVT
•
Diagnosed by lack of vein compression when external pressure is applied
using the transducer. Veins will compress readily, with arterial compression
requiring significantly higher force. If arterial compression occurs prior to vein
compression, a DVT should be suspected.
•
Thrombus
•
An acute thrombus appears as hyperechoic material filling the vessel lumen.
As the clot matures, the ultrasound appearance will be increasingly
hypoechoic.
•
Free-floating thrombus is at high risk for embolization.
•
Appears as a hyperechoic band inside the vessel lumen, which moves with
vessel flow
105

•
Chronic DVT
•
A non-compressible vein may also be encountered with chronic DVTs. When a
DVT re-canulates, the walls of the vein may become stiff and unresponsive to
compression. Differentiation between an acute DVT and a chronic DVT can be
difficult and may require additional diagnostic studies.
Normal Measurements
•
None
Reports
•
Split screen of common femoral vein above the sapheno-femoral junction
(compressed and non-compressed)
•
Split screen of bifurcation of the CFV into the SFV and DFV (compressed and non-
compressed)
•
Split screen of popliteal vein (compressed and non-compressed)
Pearls
•
The superficial femoral vein is a deep vein, and a clot in the superficial femoral
vein is a DVT. Similarly, a clot in the proximal saphenous vein has a high
probability of propagating into the CFV and should also be treated as a DVT.
•
In the presence of low clinical suspicion, negative D-dimer, and negative
emergency ultrasound, the patient does not need a repeat examination. All other
situations need a repeat ultrasound examination in 5-7 days.
•
Veins may collapse easily with pressure from the transducer. If a vein cannot be
visualized, less pressure should be applied on the transducer.
•
Often an adjacent bone or tendon may prevent a segment of a vein from
compressing. Adjusting the probe position and direction of force or repositioning
the patient may achieve compression.
106
Pitfalls
•
Calf vein clots can be difficult to diagnose by any modality.
•
Therefore, unless there is a low clinical suspicion for a DVT and the D-dimer is not
elevated, all patients with a negative study for DVT should be referred for repeat
testing in 5-7 days to detect any calf vein thrombosis propagation into the deep
vein system.
•
Do not rely on visualization of a clot as the appearance of the clot changes with
maturation and may be missed by appearance only.
•
Ensure that the CFV, sapheno-femoral junction, DFV, SFV, and popliteal veins are
identified and compressible, or small DVTs may be missed.
•
Ensure complete vein collapse occurs with compression. Small clots may allow
for partial vein compression.
•
Compression in long axis is not reliable because sliding off midline may give the
appearance of compression.
Clinical Integration Diagram
107
DVT Scan
No DVT
Repeat
ultrasound
in 5-7 days
D-dimer normal
No D-dimer or
D-dimer elevated
DVT management
Low risk/probability
Moderate or high
risk/probability
Positive
ultrasound
Negative
ultrasound
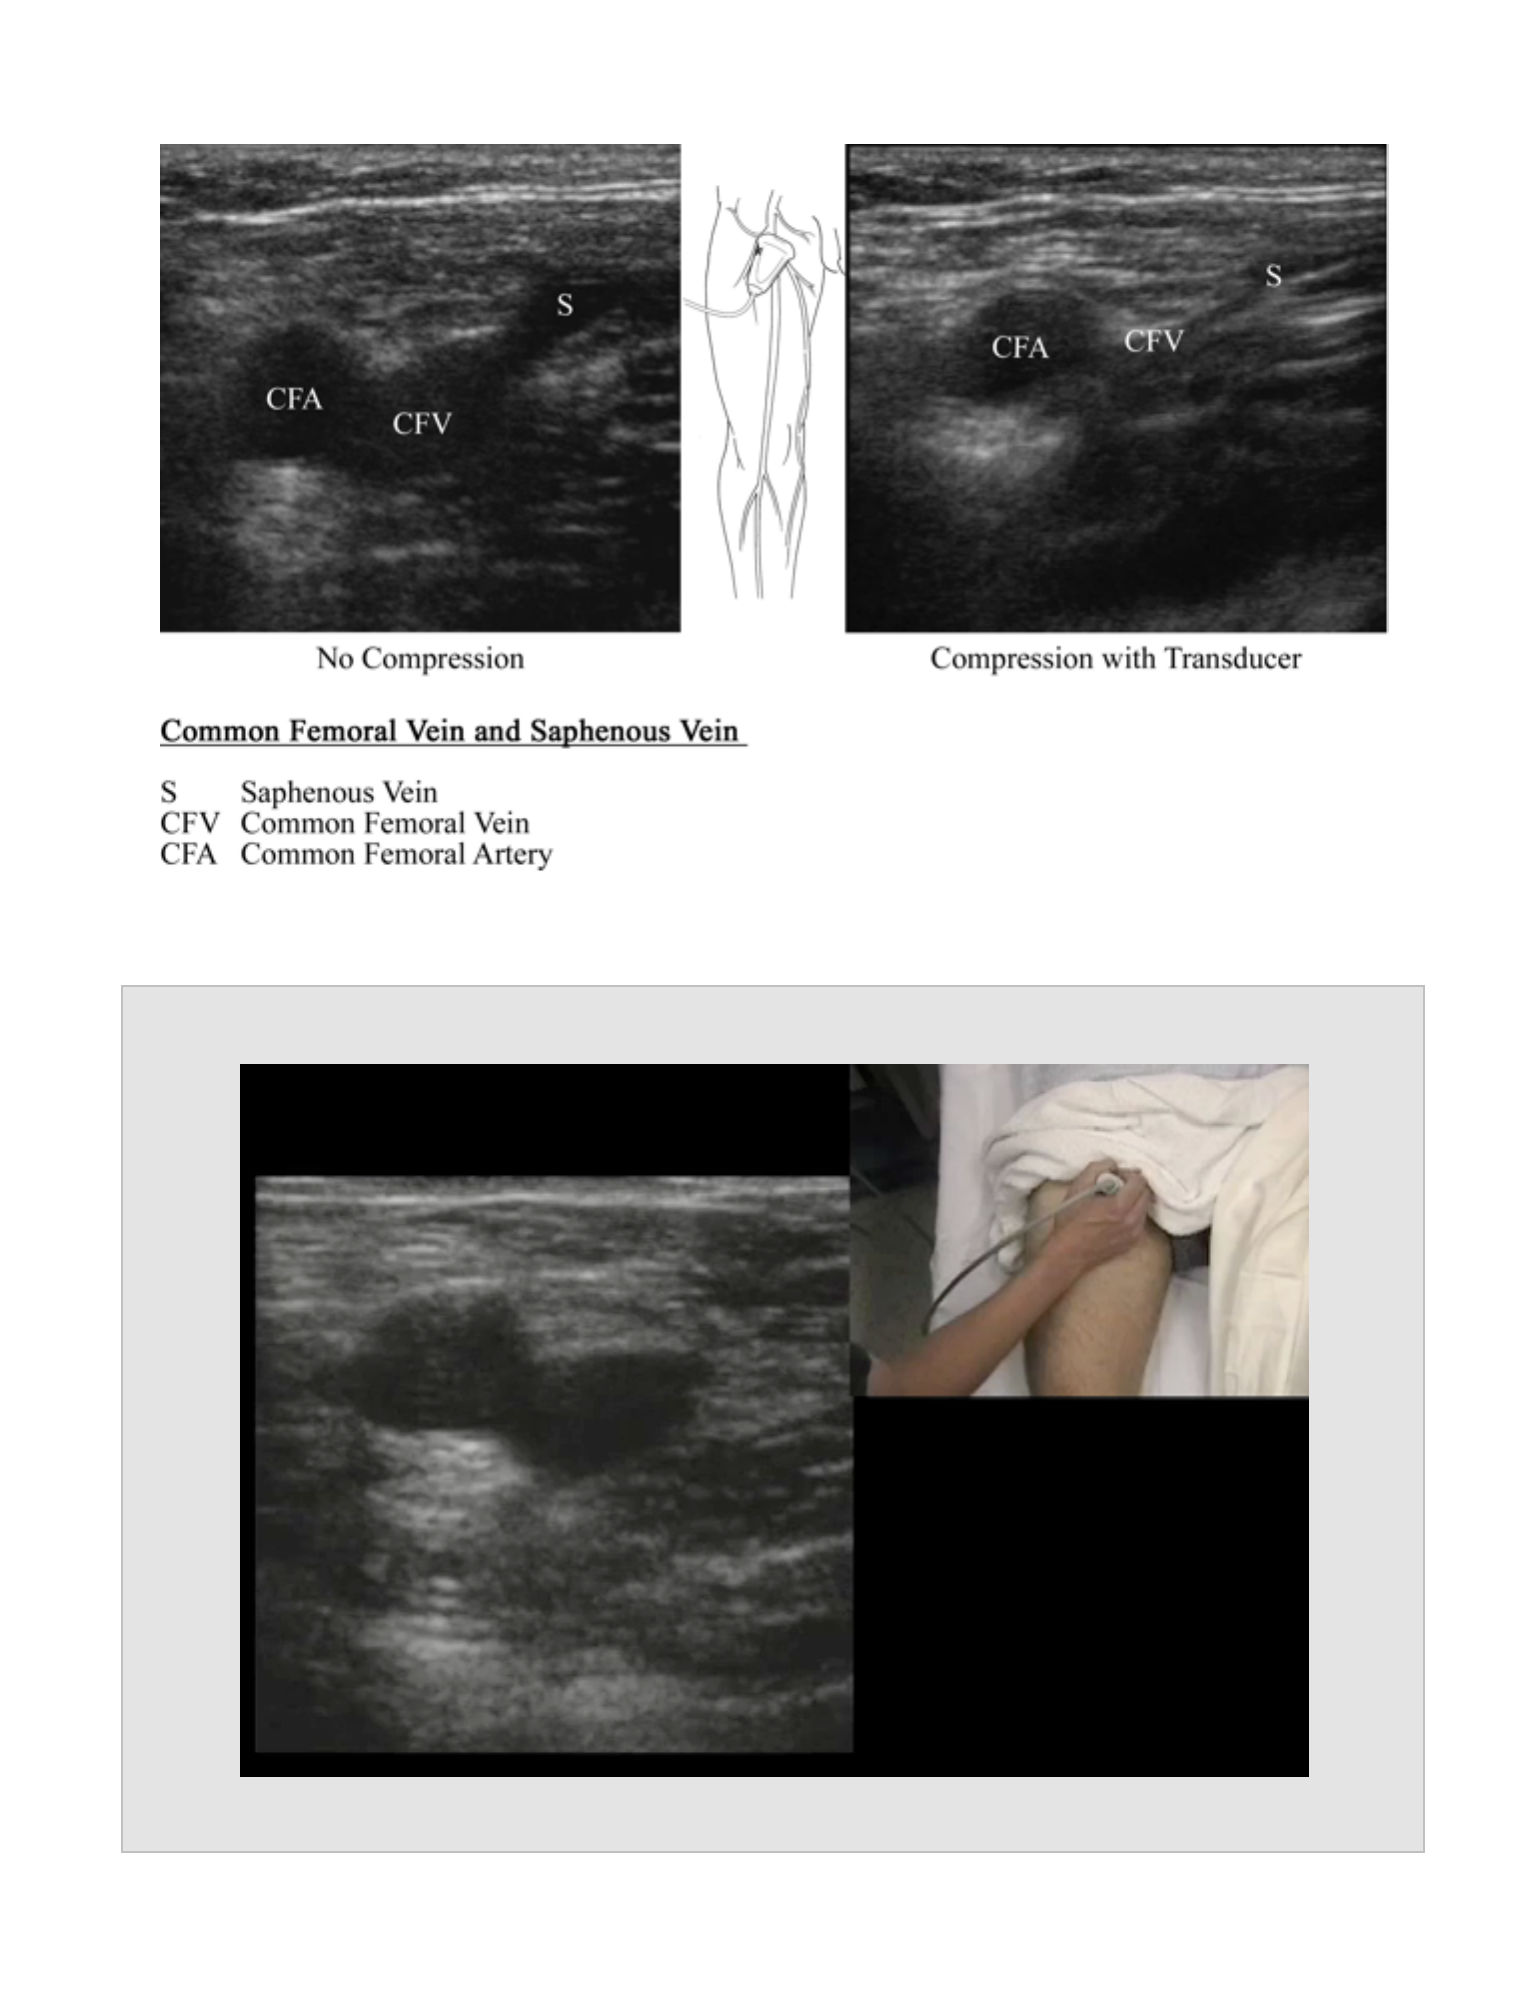
108
Evaluation for DVT
Movie 10.1
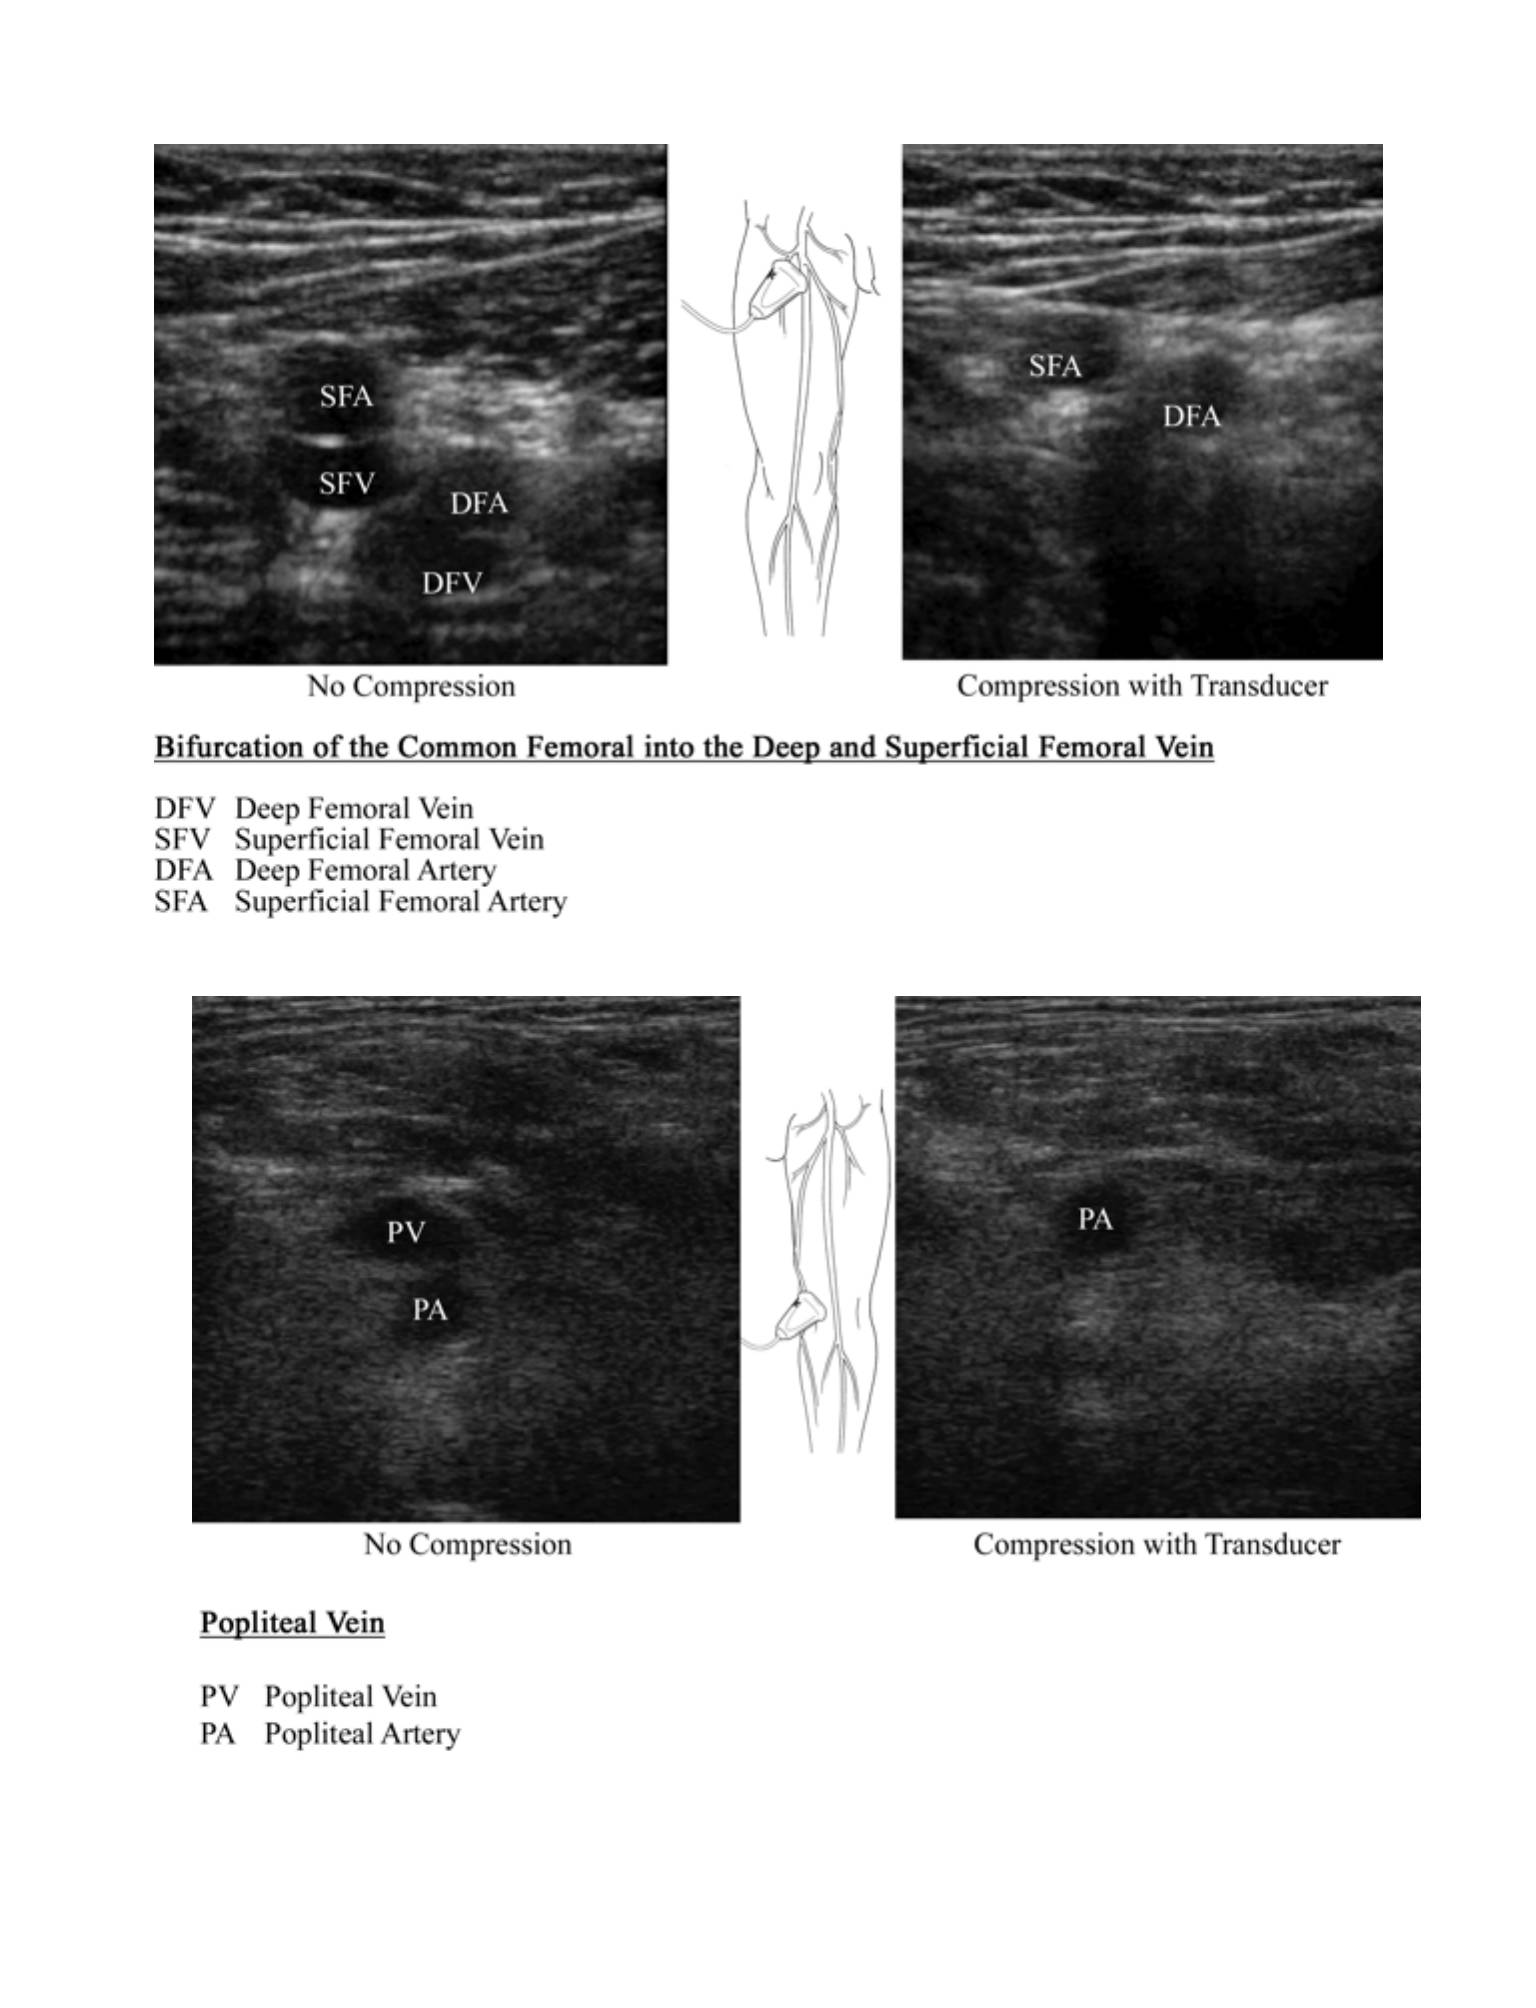
109
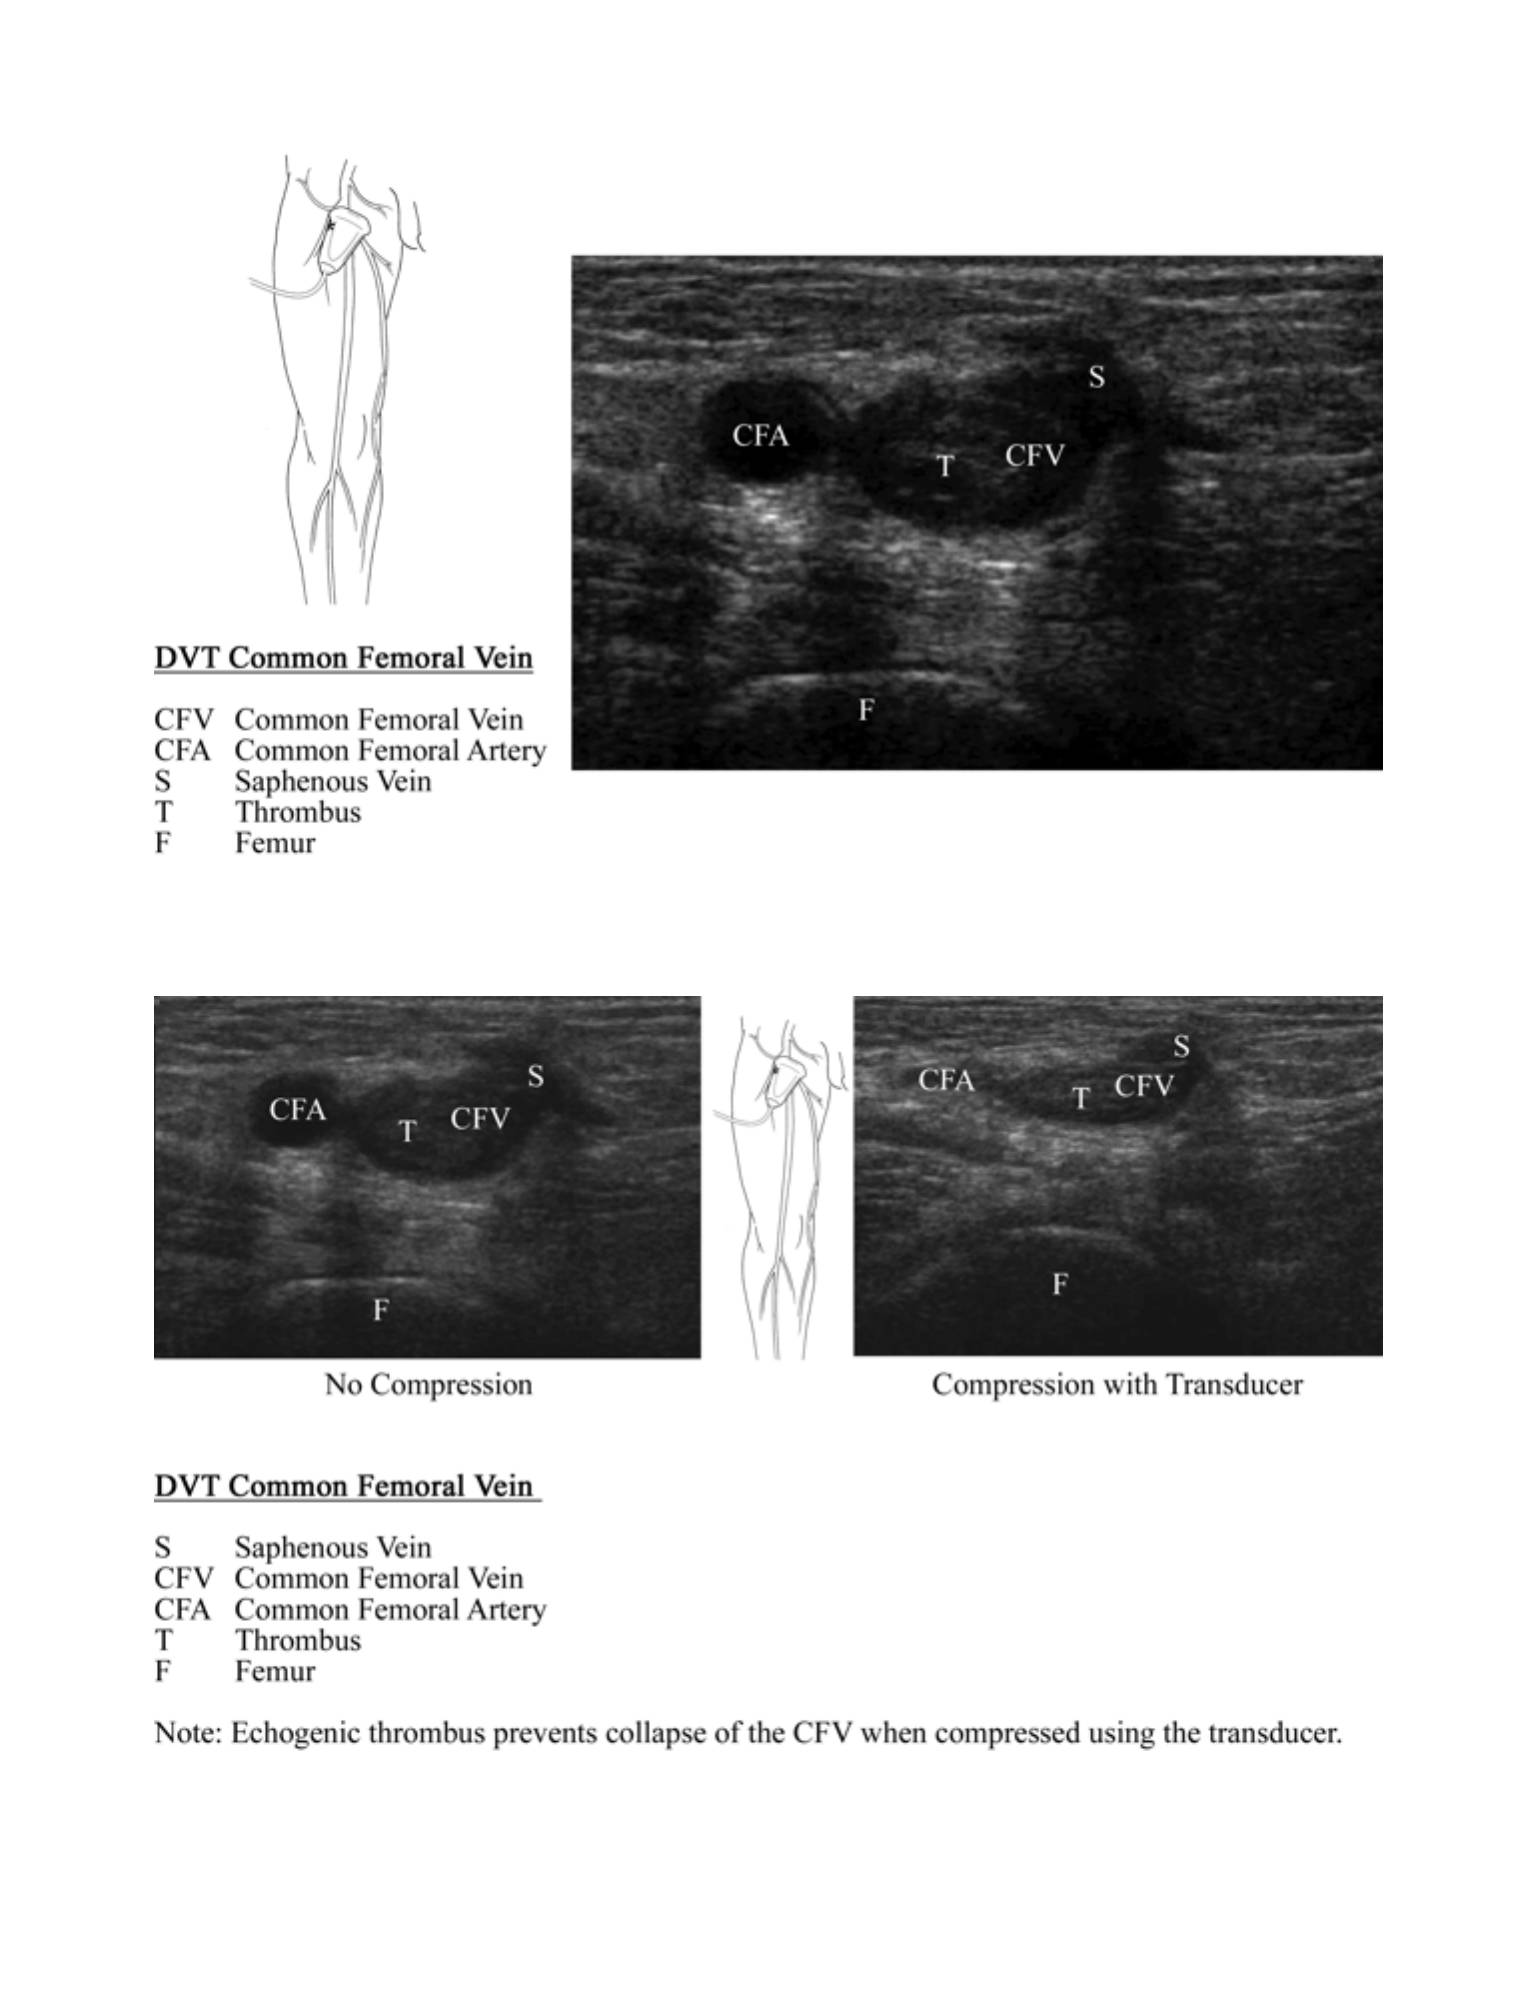
110
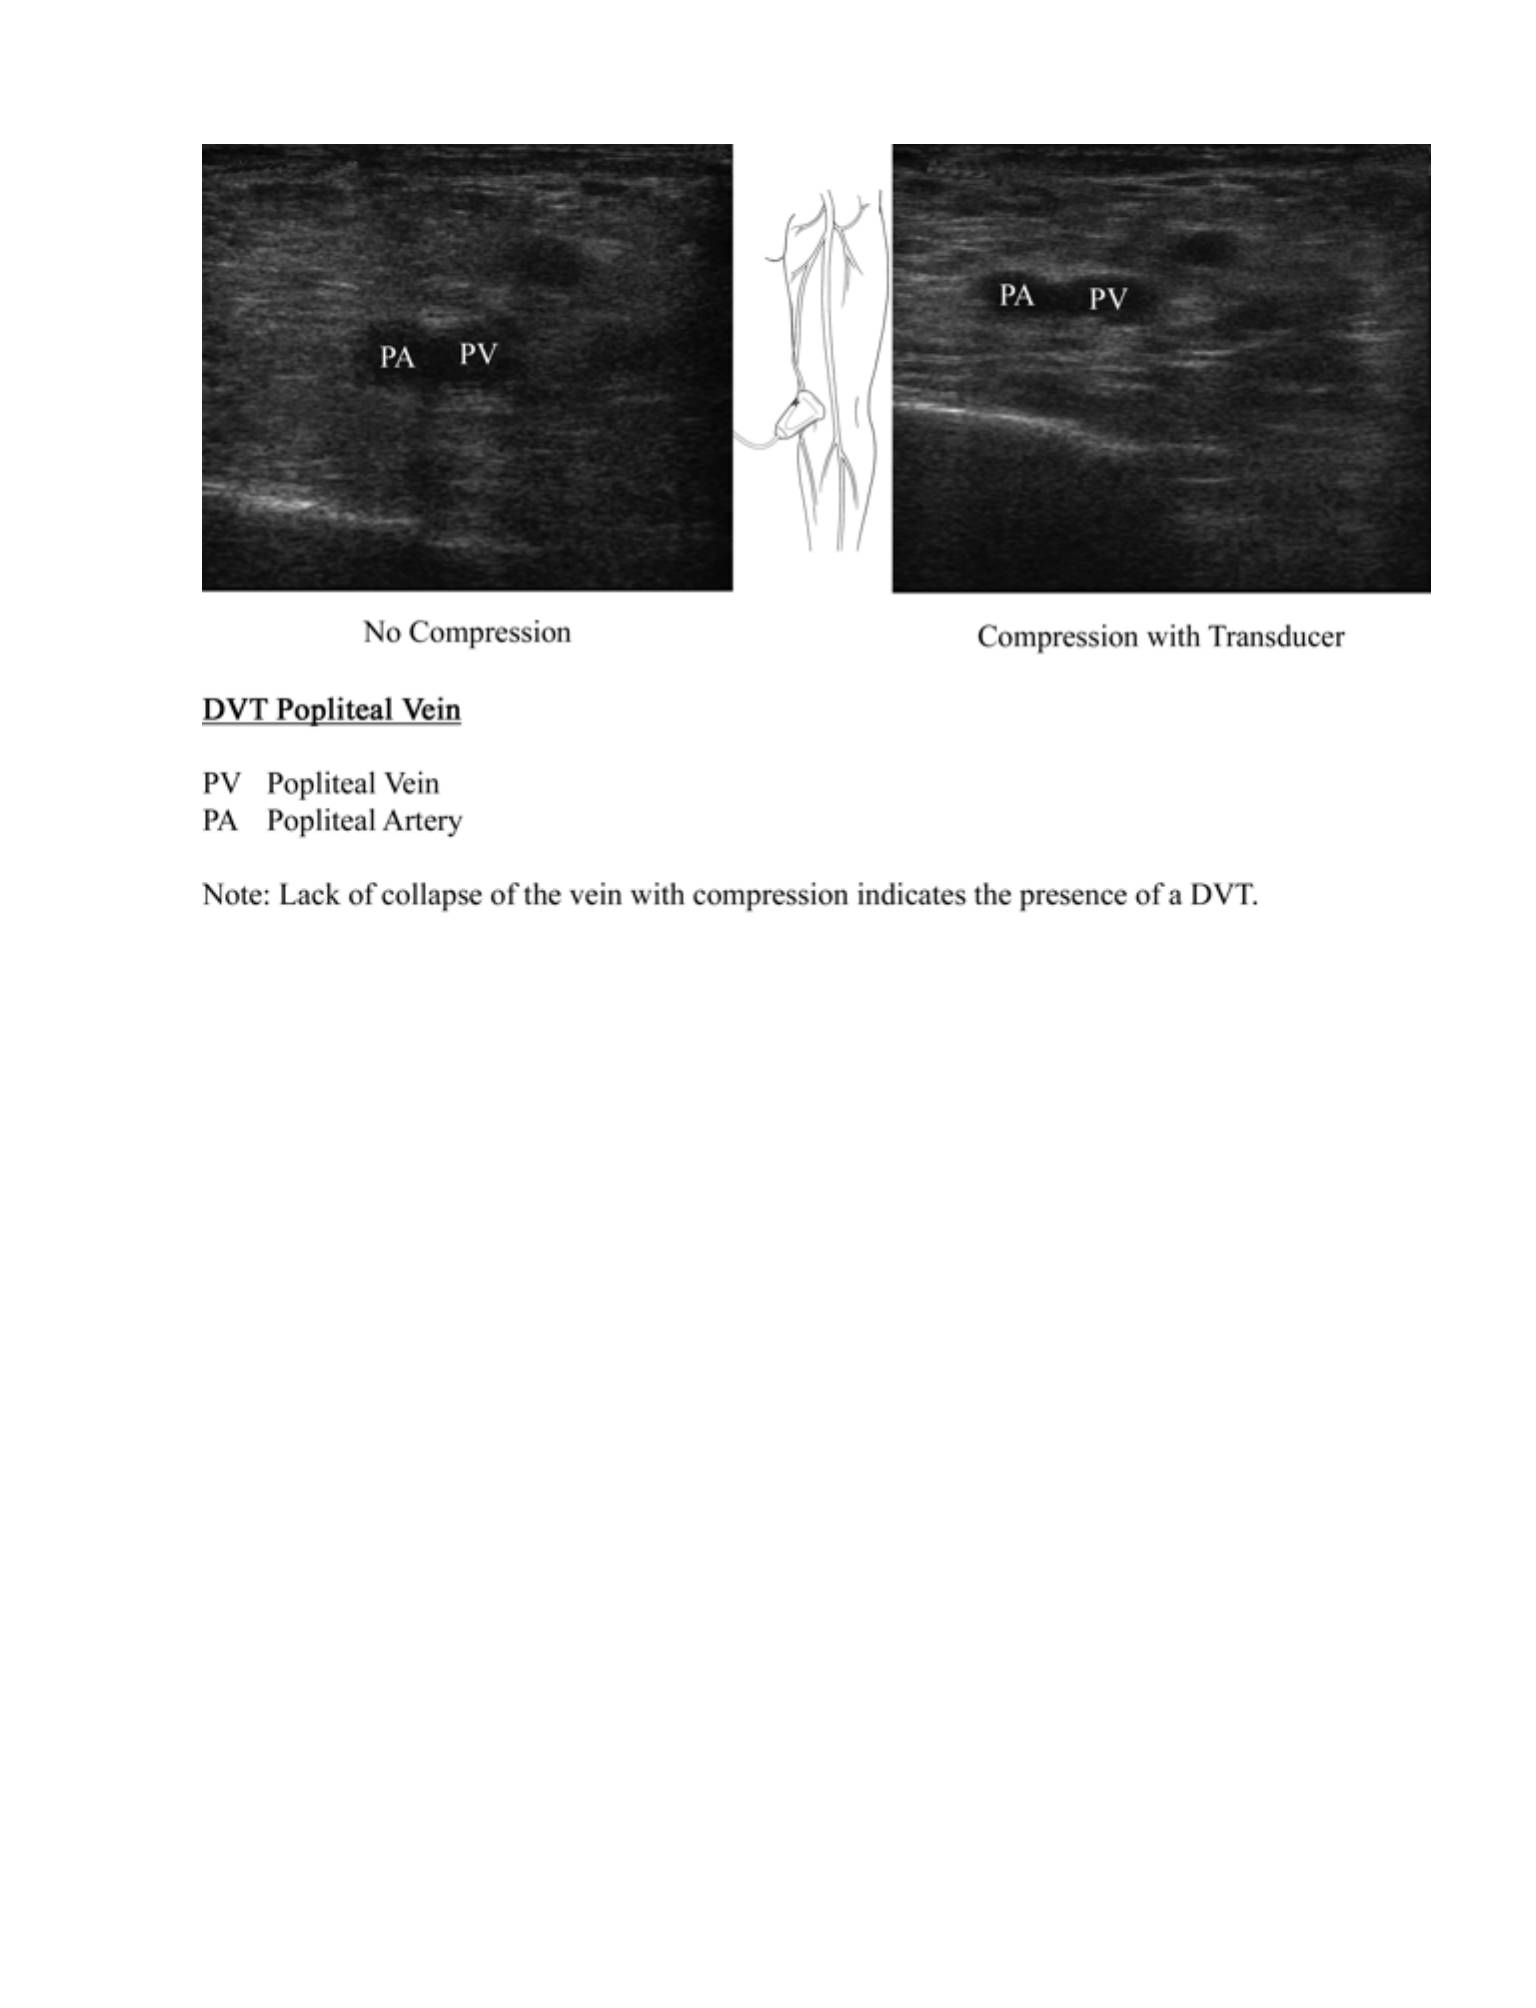
111